
说明
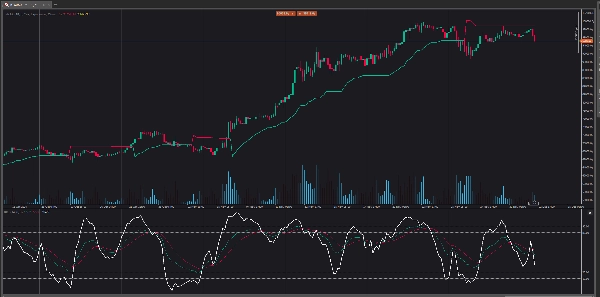
KDJ振荡器显示由3条线(K、D和J——因此得名)和2个水平线组成。使用随机振荡器时,K和D是相同的线。J线表示D值相对于K值的偏差。这些线的汇聚表示新的交易机会。像随机振荡器一样,超卖和超买水平对应趋势可能反转的时刻。
摘要
AI 摘要
The KDJ indicator is an oscillator consisting of three lines: K, D, and J, along with two reference levels. The K and D lines correspond to those used in the stochastic oscillator, while the J line measures the deviation of the D value from the K value. This convergence of the three lines is used to identify potential new trading opportunities. Similar to the stochastic oscillator, the KDJ indicator highlights overbought and oversold conditions, which often signal possible trend reversals. This tool is designed to assist traders in timing entries and exits by analyzing momentum and trend strength through these oscillating lines.
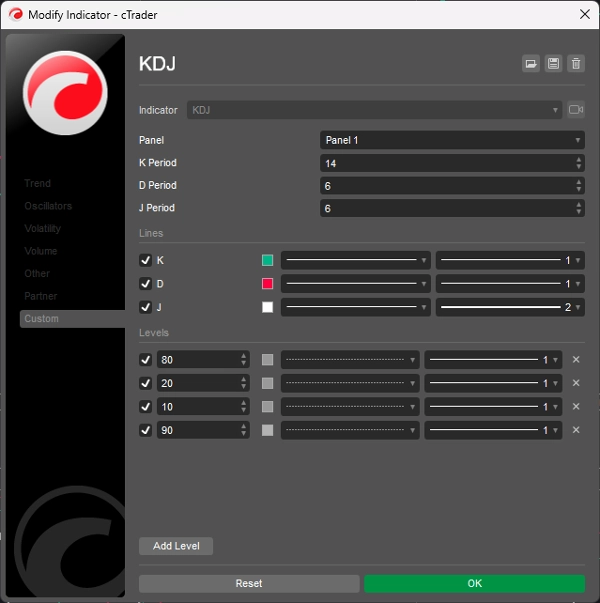
指标配置
客户评价
5.0
评价:1
5 | 100 % | |
4 | 0 % | |
3 | 0 % | |
2 | 0 % | |
1 | 0 % |
客户评价
August 18, 2025
Pros: Three-line stochastic oscillator (K, D, J) that identifies overbought/oversold levels and momentum shifts. Supports divergence analysis and crossovers between K and D as trading signals. Lightweight and responsive. Cons: No alerts, tooltips, or settings presets. J‑line can generate outlier v
讨论
常见问答
cTrader Store 提供的所有产品,包括交易机器人、指标和插件,均由第三方开发者提供,仅供信息参考和技术访问之用。cTrader Store 并非经纪商,不提供投资建议、个人推荐或任何未来业绩保证。


猜您喜欢


价格
2
销售
6.89K
免费安装