
说明
https://chartshots.spotware.com/c/695be69b1a3ca
https://chartshots.spotware.com/c/695be2a98e848
https://chartshots.spotware.com/c/695be7e8e88fa
https://chartshots.spotware.com/c/695be31346fe7
https://chartshots.spotware.com/c/695be3bd18aea
https://chartshots.spotware.com/c/695be5d5687c7
自动图表形态
📊 这是什么?
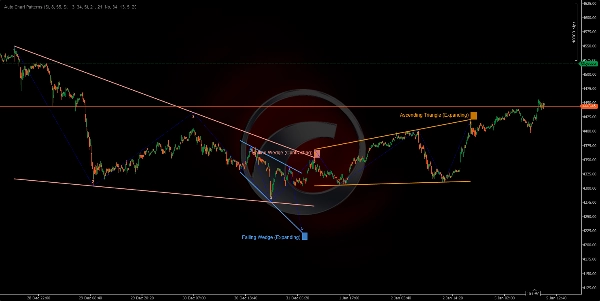
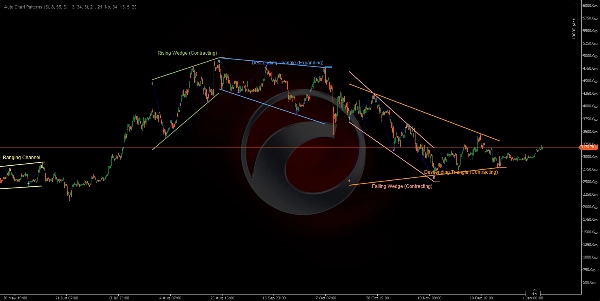
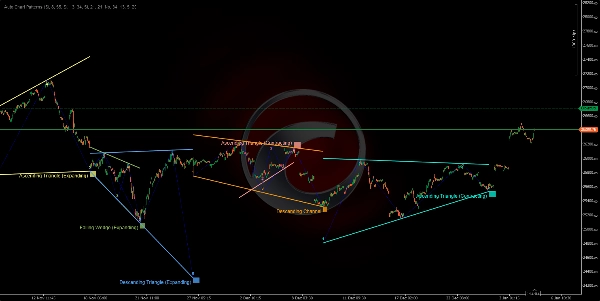
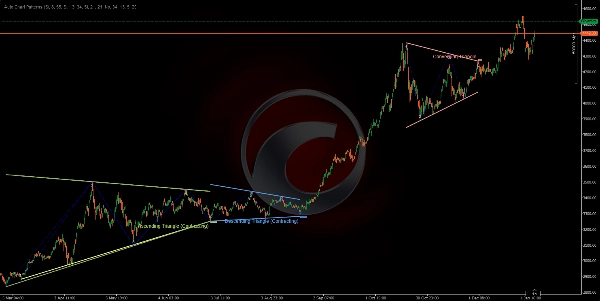
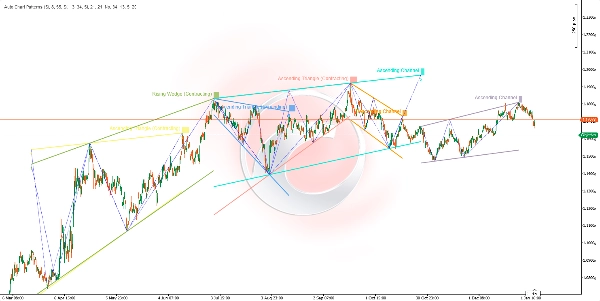
该 自动图表形态指标是一种高级几何形态扫描器,能够自动检测并可视化经典图表形态,利用多时间框架的摆动点分析。它识别出 14种不同的几何形态,包括通道、楔形和三角形,通过连接摆动高点和低点的趋势线,创建了一个全面的形态识别系统。
🎯 用途是什么?
该指标帮助交易者:
- 自动检测 14种经典图表形态(通道、楔形、三角形)📐
- 识别 潜在突破区域,提前预警⚡
- 通过几何价格关系 可视化市场结构🔍
- 交易 延续和反转形态,并获得视觉确认✅
- 按 趋势方向和最终枢轴类型筛选形态🎛️
- 同时分析 多个摆动时间框架,寻找共振🌊
🔍 它是如何工作的?
摆动点检测系统 📍
该指标同时运行多达 四个独立的摆动检测器,每个检测器的灵敏度均可配置:
- 检测逻辑:
-
- 监控滚动窗口(周期)内的价格高点和低点。
- 识别局部峰值(摆动高点)和谷值(摆动低点)。
- 仅在满足最小深度要求后确认摆动(防止噪音)。
- 摆动高点:价格在周期内创最高点,然后下跌
MinDepth根K线。 - 摆动低点:价格在周期内创最低点,然后上涨
MinDepth根K线。
- 四层摆动:
-
- 主摆动(默认:长度8,深度55)- 长期结构 🔵
- 次摆动(默认:长度13,深度34)- 中期结构 🟢
- 三级摆动(默认:长度21,深度21)- 短期结构 🟡
- 四级摆动(默认:禁用)- 自定义时间框架 🟣
每个检测器可以独立启用或禁用,以专注于特定的市场结构。
形态形成过程 🎨
步骤1 - 枢轴点收集:
- 系统收集来自任何活动检测器的 最近5或6个摆动点。
- 点必须在高点和低点之间交替(之字形结构)。
- 5点示例:高 → 低 → 高 → 低 → 高。
步骤2 - 趋势线构建:
- 将枢轴点分为上方点(摆动高点)和下方点(摆动低点)。
- 绘制两条趋势线:上边界线和下边界线。
- 对于3点边界:测试3种组合(0-2,0-1,1-2),选择最佳拟合 ⭐
- 验证趋势线不穿透蜡烛实体(仅允许穿透影线)。
- 计算拟合分数:线必须触及枢轴间<20%的K线。
步骤3 - 几何分析:
- 测量上边界和下边界之间的角度关系。
- 判断形态是 扩张型(变宽)、 收缩型(变窄)还是 平行型(宽度不变)。
- 识别趋势方向: 向上、向下或中性(水平)。
- 根据几何形态分类为 14种形态类型。
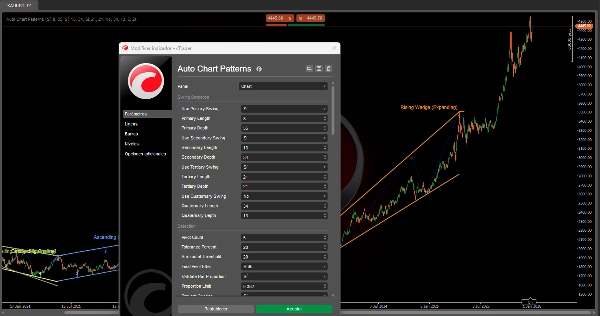
步骤4 - 验证与筛选:
- K线比例检查:确保摆动间距成比例(防止形态失真)✅
- 重叠防止:阻止与现有形态冲突的新形态🚫
- 重复检查:防止重复绘制相同形态。
- 最终枢轴筛选:仅显示以指定枢轴方向(向上/向下/两者)结束的形态。
- 形态类型筛选:启用/禁用特定形态类别。
步骤5 - 可视化:
- 用12色调色板中的鲜艳颜色绘制上下边界线 🎨
- 可选显示连接枢轴点的之字形摆动线(蓝色虚线)。
- 在每个摆动点显示枢轴编号(1、2、3、4、5)。
- 在最终枢轴处标注形态名称。
- 标签背景色编码以增强清晰度。
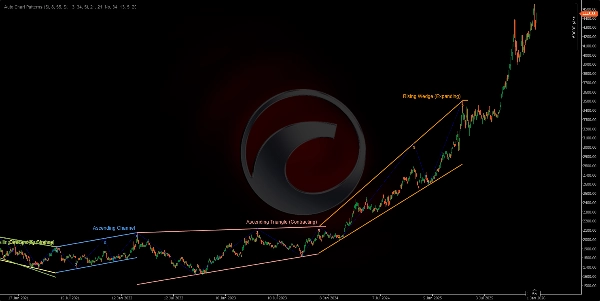
📐 14种检测到的形态
通道(平行形态)📦
- 上升通道(向上平行)📈
-
- 两条边界线以相似角度向上倾斜。
- 表示看涨延续趋势。
- 交易策略:在下边界买入,上边界卖出。
- 下降通道(向下平行)📉
-
- 两条边界线以相似角度向下倾斜。
- 表示看跌延续趋势。
- 交易策略:在上边界卖出,下边界买入。
- 震荡通道(横向/水平)↔️
-
- 两条边界线几乎水平。
- 表示盘整或犹豫不决。
- 交易策略:区间交易,支撑买入/阻力卖出。
扩张楔形(扩展形态)📣
4. 上升楔形(扩张)⚠️
* 两条边界线向上倾斜,间距逐渐扩大。
* 看跌反转形态——价格失去上行动力。
* 交易策略:等待下边界突破,做空。
5. 下降楔形(扩张)⚠️
* 两条边界线向下倾斜,间距逐渐扩大。
* 看涨反转形态——价格失去下行动力。
* 交易策略:等待上边界突破,做多。
6. 发散三角形(扩展三角形)🔺
* 上边界向上倾斜,下边界向下倾斜。
* 高波动性扩展形态。
* 交易策略:极其风险,等待明确的方向突破。
7. 上升三角形(扩张)📊
* 上边界水平,下边界向上倾斜。
* 看涨延续,范围扩大。
* 交易策略:买入上边界突破。
8. 下降三角形(扩张)📊
* 下边界水平,上边界向下倾斜。
* 看跌延续,范围扩大。
* 交易策略:卖出下边界跌破。
收缩楔形(收敛形态)🔻
9. 上升楔形(收缩)🔺
* 两条边界线向上倾斜,间距逐渐缩小。
* 看跌反转形态——看涨力竭⚠️
* 交易策略:下边界突破做空。
10. 下降楔形(收缩)🔻
* 两条边界线向下倾斜,间距逐渐缩小。
* 看涨反转形态——看跌力竭⚠️
* 交易策略:上边界突破做多。
收缩三角形(盘整形态)△
11. 收敛三角形(对称三角形)⚖️
* 上边界向下倾斜,下边界以相似速度向上倾斜。
* 中性盘整——延续形态。
* 交易策略:等待突破方向,按方向交易。
12. 下降三角形(收缩)📐
* 下边界水平(支撑),上边界向下倾斜。
* 看跌延续形态🔴
* 交易策略:支撑位突破时做空并伴随成交量。
13. 上升三角形(收缩)📐
* 上边界水平(阻力),下边界向上倾斜。
* 看涨延续形态🟢
* 交易策略:阻力位突破时做多并伴随成交量。
14. 无效/未知❌
* 不符合几何标准的形态。
* 自动过滤。
摘要
Key functionalities include identifying potential breakout zones, visualizing market structure through geometric price relationships, and supporting trading of continuation and reversal patterns with visual confirmation. Users can filter detected patterns by trend direction, pivot type, and formation category. The indicator prevents overlapping and duplicate patterns to maintain clarity.
The 14 detected formations cover a range of classical patterns such as ascending, descending, and ranging channels; expanding and contracting wedges; and various triangle types (converging, diverging, ascending, descending). Visual outputs include color-coded boundary lines, pivot numbering, zigzag swing lines, and labeled pattern names for easy interpretation. This tool supports analysis across multiple markets including Forex, stocks, commodities, indices, and cryptocurrencies.
客户评价
5 | 50 % | |
4 | 50 % | |
3 | 0 % | |
2 | 0 % | |
1 | 0 % |


!["[Stellar Strategies] Market Session Ultimate" 标识](https://cdn.ctrader.com/image/webp/61ffd537-0125-4246-9e72-42eca1791d64_28232)


!["High-Low Divergence [Iridio Capital]" 标识](https://cdn.ctrader.com/image/webp/443c4661-7abb-40f1-842f-4b6ec560649b_40914)
!["[Hamster-Coder] Moving Average MTF" 标识](https://cdn.ctrader.com/image/webp/b11b98b1-194d-4b8e-b00e-d611826ad159_31226)


!["[Stellar Strategies] MARSI Signal Plotter" 标识](https://cdn.ctrader.com/image/webp/7b2b8da6-8f8e-4646-8d4a-4710c516c01e_25567)