
Mô tả
Chỉ báo Pinescriptlabs Store: 🤖Pinescriptlabs Store cBots :
ICT Power of 3 (cBot) Gold & BTC BreakoutSession Pivots(mới)YieldShield"
SmartTrend Support &
Resistance Lines
Dynamic Market Structure
Phân tích các điểm quay đầu
Fibonacci Linear
Hồi quy đa khung thời gian
Multi-Level Candle Bias
Tracker
Auto Support and
Resistance Trend Lines
All Support and
Resistance Levels
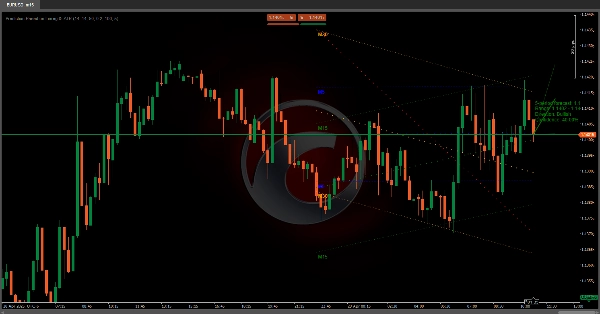
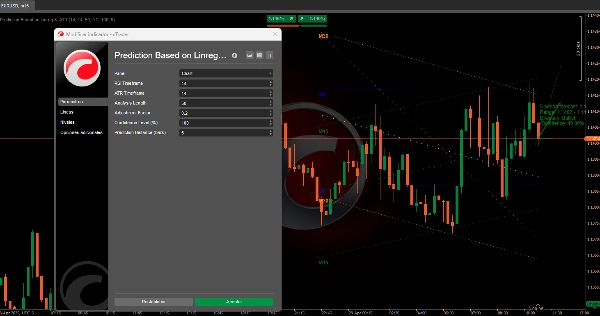
📈 Kênh Hồi Quy Đa Khung Thời Gian & Thuật Toán Dự Đoán ATR
Hệ thống này dự đoán biến động giá tiềm năng của tài sản bằng cách kết hợp phân tích xu hướng đa khung thời gian 📊, biến động thị trường 📉, và xác nhận chỉ báo kỹ thuật ✅. Mục tiêu của nó là dự báo khoảng giá tương lai với độ tin cậy có thể đo lường, lý tưởng để xác định cơ hội rủi ro-lợi nhuận có xác suất cao 💰.
🔧 Cách Hoạt Động Từng Bước
1️⃣ Phân Tích Xu Hướng Đa Khung Thời Gian
- Kênh hồi quy trên các khung thời gian:
Thuật toán phân tích đồng thời bốn khung thời gian khác nhau (từ ngắn hạn đến dài hạn). Với mỗi khung: -
- Tính toán một đường xu hướng thống kê dựa trên hành vi giá lịch sử.
- Xác định một kênh dự đoán xung quanh đường này (sử dụng biến động quá khứ để thiết lập giới hạn trên/dưới).
- Ảnh hưởng theo thứ bậc:
Các khung thời gian ngắn hơn có trọng số lớn hơn trong hướng cuối cùng, phản ánh độ nhạy với các biến động gần đây.
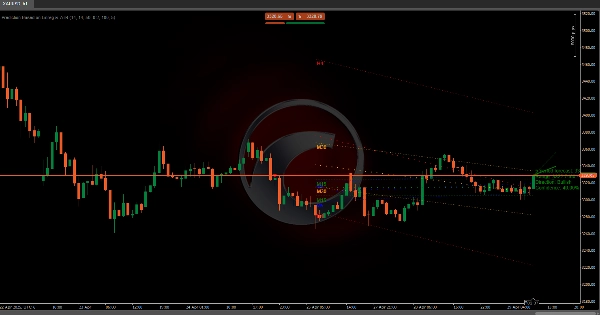
2️⃣ Tích hợp Biến Động (ATR) 🌊
- Điều chỉnh biến động động:
Dự đoán thích ứng với điều kiện thị trường hiện tại: -
- Biến động cao → Dự báo rộng hơn
- Biến động thấp → Điều chỉnh thận trọng
- Tỷ lệ phạm vi tương lai:
Dải dự đoán tự động điều chỉnh dựa trên biến động dự kiến.
3️⃣ Hệ Thống Xác Nhận Xu Hướng ✅
Kết hợp bốn tín hiệu chính để xác thực hoặc thách thức hướng dựa trên hồi quy:
- Giao cắt Đường Trung Bình Động (xác nhận xu hướng)
- Bộ dao động Động lượng (đánh giá sức mạnh)
- Chỉ báo Biến động (phát hiện mua quá mức/bán quá mức)
- Phân tích Phân kỳ (manh mối đảo chiều xu hướng)
- Kết quả: Một hệ thống điểm số tăng cường hoặc đặt câu hỏi về xu hướng dự đoán.
4️⃣ Tính Toán Độ Tin Cậy 🎯
- Căn chỉnh khung thời gian:
Độ tin cậy tăng khi các xu hướng đồng thuận trên các khung thời gian. - Ngưỡng do người dùng định nghĩa:
Người giao dịch có thể đặt mức độ tin cậy tối thiểu để lọc chỉ các tín hiệu có độ chắc chắn cao.
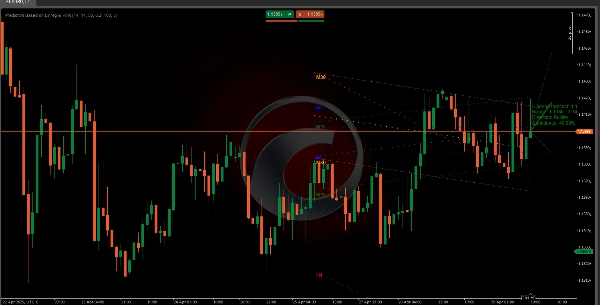
5️⃣ Trực quan hóa trực quan 📉📈
- Đường dự đoán:
Hiển thị đường đi kỳ vọng trung tâm (xanh lá = tăng 🟢, đỏ = giảm 🔴, xám = trung tính ⚪). - Dải phạm vi:
Làm nổi bật vùng biến động giá có xác suất cao nhất, được điều chỉnh theo biến động. - Nhãn thông tin:
Tóm tắt giá dự kiến, phạm vi, hướng đi và mức độ tin cậy.
🌟 Ưu điểm chính
- Phương pháp đa chiều: Kết hợp xu hướng, biến động & động lượng để giảm tín hiệu sai.
- Tự điều chỉnh: Tự động thích ứng với thị trường dao động hoặc xu hướng.
- Chỉ số minh bạch: Độ tin cậy có thể định lượng giúp quản lý kỳ vọng.
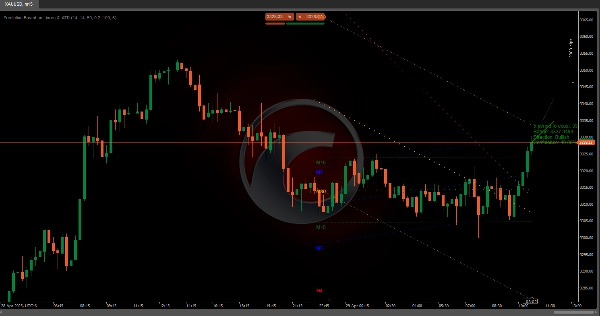
📌 Ví dụ thực tế
Nếu hệ thống phát hiện:
- Xu hướng tăng trong các khung thời gian ngắn + xác nhận động lượng
- Biến động gần đây thấp
- Sự đồng thuận mạnh mẽ giữa các khung thời gian
→ Dự báo giá tăng với dải hẹp và độ tin cậy cao (ví dụ, 85%) 🚀
Tóm tắt
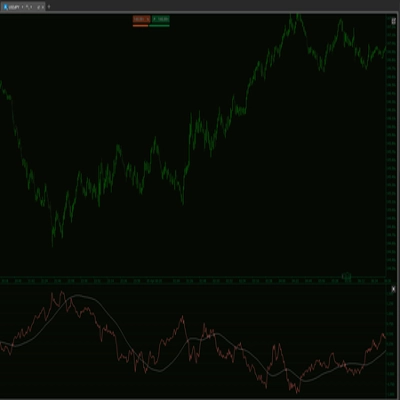
The ATR component dynamically adjusts the prediction bands to current market conditions, widening during high volatility and narrowing during low volatility periods. A trend confirmation system integrates four key signals—moving average crosses, momentum oscillators, volatility indicators, and divergence analysis—to validate or question the regression-based trend, producing a scoring system that indicates trend strength.
Confidence levels are calculated based on alignment of trends across timeframes, with user-configurable thresholds to filter signals by certainty. Visualization includes a central prediction line (color-coded for bullish, bearish, or neutral trends), range bands highlighting probable price zones, and an info label summarizing projected price, range, direction, and confidence.
The indicator supports markets including cryptocurrencies (e.g., BTCUSD), commodities (e.g., XAUUSD), and others. It aims to identify high-probability risk-reward opportunities by combining trend, volatility, and momentum analysis in a self-adjusting, transparent framework.


![Logo "[CB] Pivot Points Pro"](https://cdn.ctrader.com/image/webp/43463c82-67b0-4f10-a4ba-901bba091d81_32594)