说明
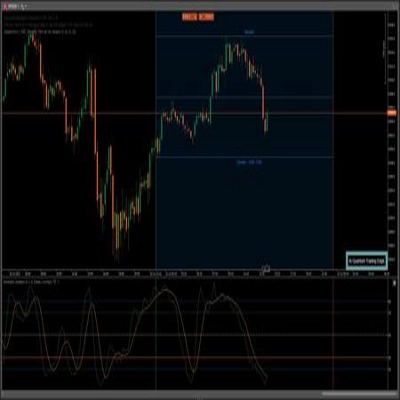
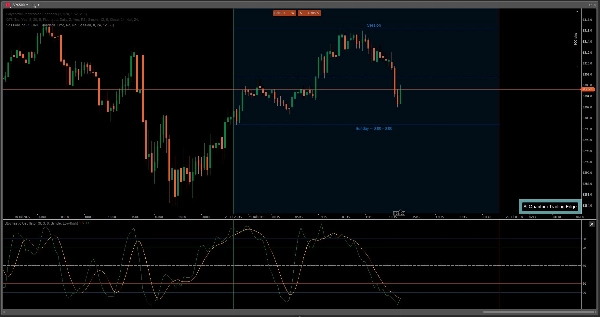
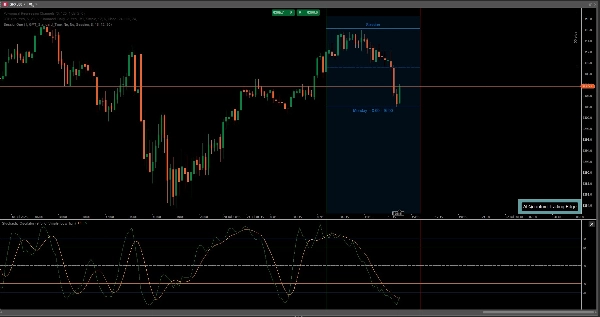
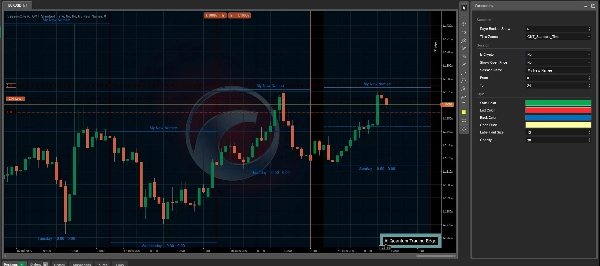
Session One 是一个用于标记起止时间的工具,如果您已经设置了想要交易的时间段,这个工具非常有用。您可以更改名称并标记时间从 0:00 到 0:00 或(0:00 到 24:00)
摘要
AI 摘要
SessionOne is an indicator tool designed to visually mark specific trading sessions on a chart. It allows users to define custom time intervals, from any start time to any end time within a 24-hour period, to highlight the hours during which they prefer to trade. The tool supports renaming the session labels for clarity. SessionOne is applicable across various markets and symbols, including Forex pairs (EURUSD, GBPUSD, NZDUSD, USDJPY), cryptocurrencies (BTCUSD), commodities (XAUUSD), indices (NAS100), and stocks. This functionality aids traders in focusing on their preferred trading hours by clearly delineating session times on their charts.
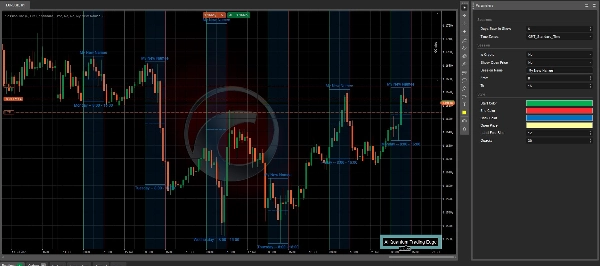
指标配置
客户评价
5.0
评价:1
5 | 100 % | |
4 | 0 % | |
3 | 0 % | |
2 | 0 % | |
1 | 0 % |
客户评价
October 8, 2025
Clean and handy! 🕒 Marks London, NY, and Asia sessions right on your chart. Perfect for intraday traders tracking volatility bursts — simple, light, and super useful!
讨论
常见问答
BTCUSD
Forex
Signal
Indices
EURUSD
Commodities
GBPUSD
NZDUSD
Prop
Crypto
Stocks
XAUUSD
NAS100
USDJPY
cTrader Store 提供的所有产品,包括交易机器人、指标和插件,均由第三方开发者提供,仅供信息参考和技术访问之用。cTrader Store 并非经纪商,不提供投资建议、个人推荐或任何未来业绩保证。


价格
147
销售
11.2K
免费安装