
说明
⭐ 多时间框架 SMC 区域™ 🇫🇮
跨五个时间框架的机构供需映射 — 自动完成。
专业产品
多时间框架 SMC 区域引擎™ 是一款精确构建的智能资金概念指标,能够自动检测、绘制并同步五个主要时间框架的机构供需区域 — 全部实时显示,直接在您的图表上。
该工具专为依赖市场结构、流动性行为和机构足迹的交易者设计,消除了手动标记区域的猜测和不一致性。无论您是日内交易还是波段交易,多时间框架 SMC 区域引擎™ 都能为您提供市场最可能反应位置的完整多层地图。
这不仅仅是一个指标。
它是一个多时间框架的 SMC 智能系统。
核心功能
自动供需区域检测
引擎扫描每个时间框架上最近的 X 根柱(用户定义),并识别:
需求区(看涨失衡)
供应区(看跌失衡)
区域通过蜡烛结构验证 — 确保仅显示有意义的机构足迹。
五个时间框架,一张图表
该指标同时分析
日线
4小时
1小时
30分钟
15分钟
每个时间框架分配独特颜色,为您提供清晰的分层视图,展现高时间框架的强度和低时间框架的精确度。
这种多时间框架融合是 SMC 交易者用来预测流动性扫荡、缓解区块和溢价/折扣区的关键。
动态区域投影
每个区域自动延伸至最新蜡烛,允许您查看:
价格可能反应的位置
哪些区域仍然活跃
当前价格如何与机构足迹互动
无需手动重绘。无杂乱。无过时区域。
专业视觉效果
每个区域包含:
带可调边框宽度的彩色矩形
清晰的文本标签(“需求:H1”,“供应:M15”等)
智能左移位置,避免与蜡烛重叠
结果是一个干净、可读、专业级别的 SMC 地图。
交易者为何喜爱它
消除手动标记区域
提供即时多时间框架背景
帮助识别高概率反应点
适用于基于 SMC、ICT、Wyckoff 或流动性概念的任何策略
干净的视觉效果,不会让您的图表显得杂乱
非常适合日内剥头皮交易者和波段交易者
该工具为您提供机构视角 — 无需复杂操作。
适用人群
智能资金概念交易者
ICT 风格流动性交易者
市场结构和订单流交易者
需要精确度的剥头皮交易者
需要高时间框架背景的波段交易者
任何想要干净、自动化供需地图的人
⭐ 多时间框架 SMC 区域™
以机构足迹的清晰度进行交易 — 跨越每个重要时间框架
备注
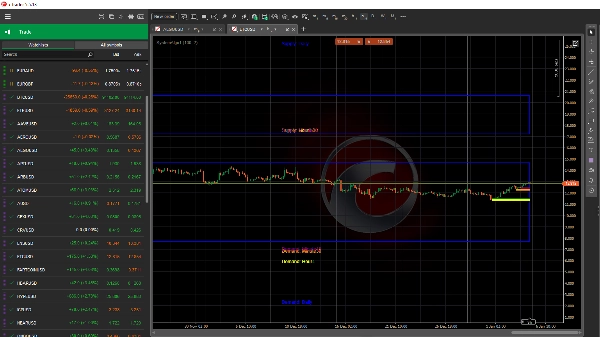
蓝色 = 日线需求/供应
绿色 = 4小时需求/供应
黄色 = 1小时需求/供应
深紫色 = 15分钟需求/供应
粉色 = 5分钟需求/供应
当重叠时 > 成功交易的概率更大
摘要
The indicator assigns unique colors to each timeframe’s zones for clear, layered visualization, enabling traders to assess higher-timeframe strength alongside lower-timeframe precision. Zones are dynamically extended to the latest candle, showing active areas where price is likely to react without manual redrawing or clutter.
Each zone is visually marked with a colored rectangle, adjustable border width, and clear text labels indicating timeframe and zone type, placed to avoid overlap with price candles. This tool supports trading strategies based on market structure, liquidity, and institutional footprints, including SMC, ICT, Wyckoff, and liquidity concepts.
SystemAlgo1 is suitable for intraday scalpers and swing traders seeking automated, multi-timeframe supply and demand mapping to identify high-probability reaction points across markets such as Forex, cryptocurrencies, indices, commodities, and stocks.


!["Smart Money Concepts (SMC) [Iridio Capital]" 标识](https://cdn.ctrader.com/image/webp/28b69fd1-ef54-4bed-9487-07e78e883be4_40934)


