คำอธิบาย
คำอธิบาย
ตัวบ่งชี้ Pinescriptlabs Store: 🤖Pinescriptlabs Store cBots :
ICT Power of 3 (cBot) Gold & BTC BreakoutSession Pivots(ใหม่)YieldShield"
SmartTrend Support &
เส้นแนวต้าน
Dynamic Market Structure
การวิเคราะห์จุดเปลี่ยน
Fibonacci Linear
Regression Multi-timeframe
Multi-Level Candle Bias
Tracker
Auto Support and
Resistance Trend Lines
All Support and
Resistance Levels
ช่อง SSL พรีเมียม 🔍
รวม การตรวจจับแนวโน้ม ผ่านค่าเฉลี่ยเคลื่อนที่, การประเมินความผันผวน ด้วยแถบที่อิง ATR และ ตัวกรองระยะสั้น (SSL) เพื่อมอบระบบวิเคราะห์แบบบูรณาการ 💡 จุดแข็งของมันอยู่ที่ความชัดเจนของสัญญาณภาพและความสามารถในการปรับตัวในตลาดต่างๆ ขณะที่ ความท้าทายหลัก คือการลดความล่าช้าและกรองการเคลื่อนไหวด้านข้าง ด้วยการตั้งค่าพารามิเตอร์ที่เหมาะสม มันจึงเป็น เครื่องมือที่ทรงพลัง สำหรับการตัดสินใจเข้า/ออกในการเทรด 🎯
1. วัตถุประสงค์ & ประโยชน์ในการเทรด 📊
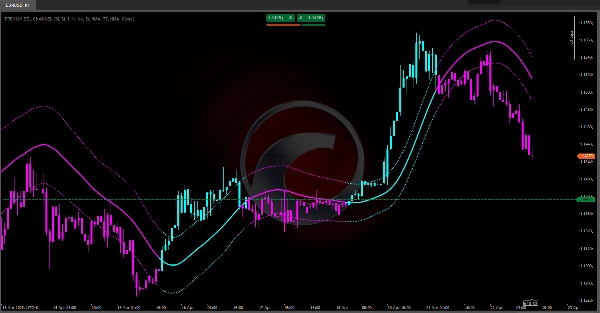
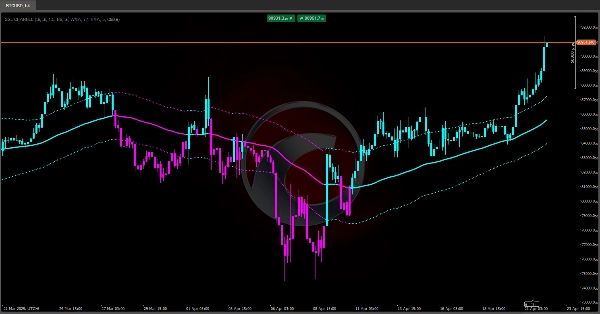
• การตรวจจับแนวโน้มหลัก: ด้วยเส้นกลาง (เรียกว่า "Baseline") ตัวบ่งชี้จะแสดงทิศทางหลักของตลาด 📈📉
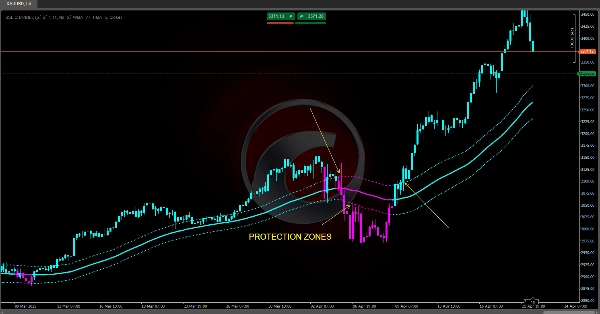
• การวัดความผันผวน: ใช้ช่วงเฉลี่ย (ATR) เพื่อปรับแถบสองแถบ (เหนือ/ใต้ Baseline) เป็นโซนแนวรับ/แนวต้านแบบไดนามิก ⚡
• ตัวกรองเสียงรบกวน & การเปลี่ยนแปลงอคติ: ช่อง SSL (ค่าเฉลี่ยเคลื่อนที่ปรับตัวตามสูง/ต่ำ) ช่วยระบุการกลับตัวระยะสั้นสำหรับการเข้า/ออกที่แม่นยำ 🔄
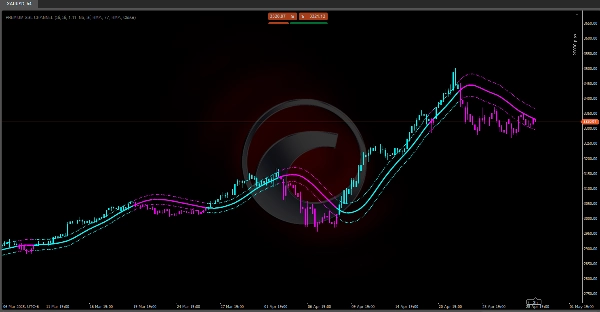
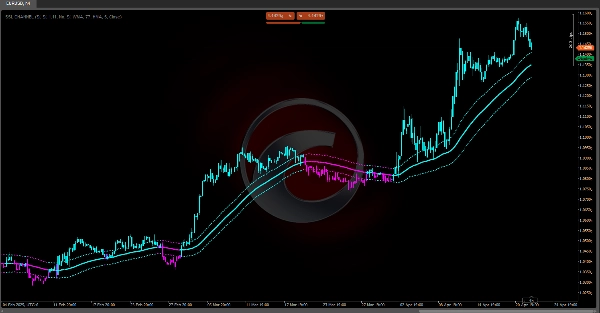
• การแสดงผลที่เข้าใจง่าย: ใช้สีแท่งราคาและเส้นตามอคติ (ฟ้า = ขาขึ้น, ม่วง = ขาลง) เพื่อการตีความทันที 🎨
2. ส่วนประกอบหลัก & ตรรกะ ⚙️
2.1. เส้นกลาง ("Baseline")
• คำนวณค่าเฉลี่ยเคลื่อนที่ราคา (SMA, EMA, WMA หรือ Hull) เพื่อทำให้เสียงรบกวนเรียบขึ้น
• แสดงค่าตลาดเฉลี่ย แสดงแนวโน้มหลัก:
- ราคาสูงกว่า → แนวโน้มขาขึ้น 🟢
- ราคาต่ำกว่า → แนวโน้มขาลง 🔴
2.2. ช่วงเฉลี่ย (ATR)
• วัดความผันผวนจริงของตลาดโดยการเฉลี่ยราคาสูงสุด/ต่ำสุด/ปิดก่อนหน้า
• ATR สูงขึ้น = ความผันผวนมากขึ้น; ATR ต่ำลง = ตลาดสงบขึ้น 🌊
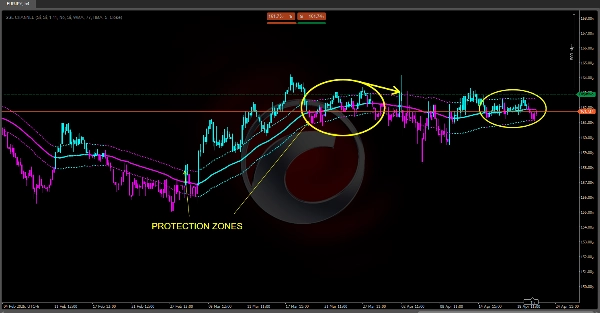
2.3. แถบไดนามิก ("Up ATR" & "Down ATR")
• Up ATR = Baseline + (ATR × ตัวคูณ)
• Down ATR = Baseline – (ATR × ตัวคูณ)
• ทำหน้าที่เป็นช่องราคาดังนี้:
- ราคาสัมผัส แถบบน → ความแข็งแกร่งขาขึ้น 🚀
- ราคาใกล้ แถบล่าง → โมเมนตัมขาลง 🐻
2.4. ช่อง SSL (Signal-Smooth-Line)
• ใช้ค่าเฉลี่ยเคลื่อนที่แยกกันสำหรับราคาสูง/ต่ำ
• ตรรกะทิศทาง:
- ปิด เหนือ MA สูง → อคติขาขึ้น ✅
- ปิด ต่ำกว่า MA ต่ำ → อคติขาลง ❌
- ระหว่าง → รักษาอคติก่อนหน้า
• ทำหน้าที่เป็น ตัวกรองแนวโน้มระยะสั้น ยืนยัน/ขัดแย้งกับ Baseline 🔄
3. การสร้างสัญญาณ & การใช้งานจริง 🛠️
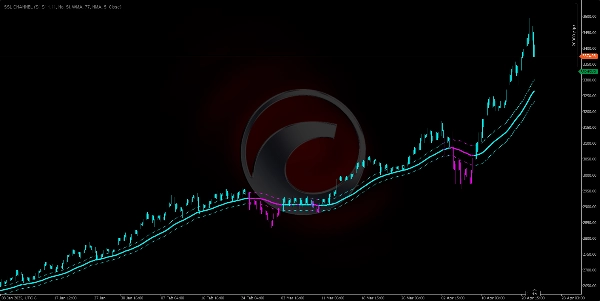
1. การยืนยันแนวโน้ม
- ขาขึ้นแรง: ราคา > Up ATR 🟢
- ขาขึ้นปานกลาง: Up ATR > ราคา > Baseline
- ขาลงปานกลาง: Baseline > ราคา > Down ATR
- ขาลงแรง: ราคา < Down ATR 🔴
2. ตัวกรอง SSL
- การเข้า: เข้าซื้อเฉพาะเมื่อ SSL อยู่ เหนือ เส้นของมัน (หรือขายสั้นถ้าอยู่ต่ำกว่า) ⬆⬇
- การออก: ออกบางส่วน/ทั้งหมดเมื่อ SSL กลับตัวและตัดผ่าน MA สูง/ต่ำ ฝั่งตรงข้าม ✋
3. การระบายสีแท่ง
- แท่งราคาจะเปลี่ยนเป็น สีฟ้า (ขาขึ้น) หรือ สีม่วง (ขาลง) โดยซิงค์กับ Baseline เพื่ออ่านตลาดได้รวดเร็ว 🎨
4. พารามิเตอร์ที่ปรับแต่งได้ & ผลกระทบ ⚖️
• ช่วงเวลา Baseline: ยาวขึ้น = เรียบแต่ล่าช้า; สั้น = ตอบสนองเร็วแต่มีเสียงรบกวน 🐢⚡
• ตัวคูณแถบ: สูงขึ้น = ช่องกว้างขึ้น (สัญญาณผิดพลาดน้อยลง); ต่ำ = ช่องแคบลง (สัญญาณมากขึ้น, ผันผวนมากขึ้น) ↔️
• ประเภท MA (SMA/EMA/WMA/HMA): มีผลต่อการถ่วงน้ำหนักราคาล่าสุดกับประวัติ 📅
• ช่วงเวลา & ประเภท SSL: กำหนดความไวของตัวกรองระยะสั้น 🎚️
สรุป
รีวิวจากลูกค้า
5 | 100 % | |
4 | 0 % | |
3 | 0 % | |
2 | 0 % | |
1 | 0 % |