![Trading product for [Stellar Strategies] Market Regime Filter 指标 Forex Indices, image 1](https://cdn.ctrader.com/image/webp/3bdeba11-7e8b-4e5f-9af9-d562f48df039_28423)
[Stellar Strategies] Market Regime Filter
指标
139 下载
版本 1.0, Apr 2025
Windows 版、Mac 版
![Trading product for [Stellar Strategies] Market Regime Filter 指标 Forex Indices, image 2](https://cdn.ctrader.com/image/webp/fca20c9e-045b-48d9-8a0b-c633040ed401_28424)
![Trading product for [Stellar Strategies] Market Regime Filter 指标 Forex Indices, image 3](https://cdn.ctrader.com/image/webp/b2dbd1b3-4b93-4837-9689-192a2d53cb06_28425)
![Trading product for [Stellar Strategies] Market Regime Filter 指标 Forex Indices, image 4](https://cdn.ctrader.com/image/webp/85c3bcad-7210-473d-a4cf-b40ce7627c83_28426)
![Trading product for [Stellar Strategies] Market Regime Filter 指标 Forex Indices, image 5](https://cdn.ctrader.com/image/webp/988a3ea3-ac76-4434-96b0-225b162f9917_28427)
说明
cTrader的市场状态过滤指标
概述:
该指标试图基于多种技术输入组合来分类当前的市场状况或“状态”。其主要目的是帮助交易者了解当前的市场环境(趋势、区间、波动)以便可能过滤交易信号或相应调整策略。
它分析:
- 趋势方向与强度: 使用指数移动平均线(EMA)和平均趋向指数(ADX)。
- 波动性: 使用平均真实波幅(ATR)或布林带宽度。
- 成交量: 可选地使用Tick成交量与其移动平均线比较以确认趋势强度。
功能:
- 多种状态: 将市场分类为不同状态:
-
- 强牛 / 强熊
- 弱牛 / 弱熊
- 牛回调 / 熊回调(趋势中的临时反向运动)
- 区间高波动 / 区间低波动
- 初始化中(指标启动期间)
- 可选波动性指标: 通过参数选择ATR或布林带宽度(
Volatility Source)。 - 状态持续过滤: 需要新状态持续至少一定数量的K线(
Min Bars In Regime)后才确认变化,减少噪音。 - 可选成交量过滤: 允许基于成交量是否显著高于其移动平均线来过滤强趋势信号(
Enable Volume Filter)。 - 声音提醒: 当确认的市场状态变化时提供可选声音通知(
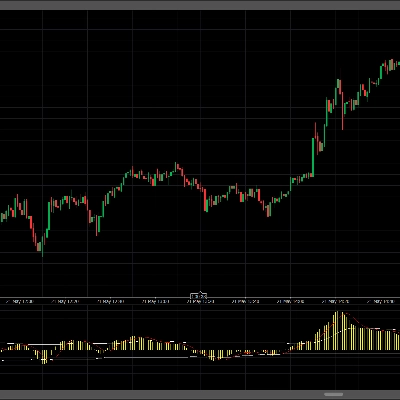
Enable Sound Alert)。 - 柱状图输出: 在指标子窗口显示当前确认的状态柱状图。高度对应状态的数值(见下方参考)。
- 文本标签: 在指标窗口右上角显示当前确认状态的名称,便于快速参考。
使用方法:
- 应用到图表: 将“市场状态过滤”指标添加到您的cTrader图表中。
- 配置参数: 调整输入参数以适应特定的交易品种、时间框架和您的交易风格。关键参数包括:
-
- 移动平均周期(快/慢)
- ADX设置(周期,阈值)
- 波动性来源及其设置(ATR/布林带宽度)
- 状态内最小K线数(确认设置)
- 成交量过滤设置(启用,周期,因子)
- 提醒设置
- 解读柱状图: 柱状图高度表示当前确认的状态。参考下方数值。一般来说:
-
- 较高数值(6-8):牛市状态。
- 较低数值(1-3):熊市状态。
- 中间数值(4-5):区间状态。
- 回调数值(2,7):较大趋势中的潜在反趋势运动。
- 过滤信号: 使用状态读数作为其他指标或策略信号的上下文过滤器。
-
- 示例: 仅在状态为强牛、牛回调或弱牛时考虑多头趋势跟随信号。仅在区间低波动或区间高波动时考虑基于区间的信号(例如振荡器反转)。
- 调整策略: 根据状态调整交易管理。
-
- 示例: 在强趋势状态下使用更宽的止损或让利润运行更长时间。在区间低波动状态下考虑更紧的获利目标。状态转换期间要谨慎。
- 使用文本标签: 通过文本标签快速了解当前状态。
- 启用提醒: 如果您想要状态变化的通知,请开启声音提醒。
注意事项:
- 参数敏感性: 指标性能高度依赖所选参数。在一个时间框架或市场上表现良好的设置,可能在另一个市场或时间框架上不适用。建议进行回测和优化。
- 滞后性: 由于指标依赖移动平均线和其他滞后成分(如ADX),状态变化通常会在实际市场变化后有一定延迟被识别。
- 震荡/转换: 市场状态转换并非总是干净利落。尤其在区间边界或趋势减弱时,可能出现快速反复震荡。参数
Min Bars In Regime有助于减少此类情况,但无法完全消除。 - 成交量可靠性: 成交量过滤使用Tick成交量,可能不代表真实市场成交量,尤其是在像外汇这样去中心化的市场中。请谨慎使用此过滤器。
- 上下文至关重要: 该指标仅提供市场的一个视角。不要单独使用。始终结合价格行为、支撑/阻力位、图表形态以及可能的其他指标进行确认。
- 初始化: 指标需要一定数量的历史K线(启动时在Automate > Log标签中显示的
Required Bars值)来完成计算。请确保图表加载了足够的数据。
状态柱状图数值(参考):
8:强牛7:牛回调6:弱牛5:区间高波动4:区间低波动3:弱熊2:熊回调1:强熊0:初始化中
摘要
AI 摘要
The Market Regime Filter indicator for cTrader classifies current market conditions into distinct regimes—such as strong/weak bull or bear trends, pullbacks, and ranging states with varying volatility—by analyzing trend direction and strength (using EMAs and ADX), volatility (via ATR or Bollinger Band Width), and optionally volume (tick volume relative to its moving average). It features a regime persistence filter that confirms changes only after a minimum number of bars to reduce noise, and an optional volume filter to validate strong trend signals. The indicator displays the confirmed regime as a histogram and a text label on the chart for quick reference, and can provide sound alerts upon regime changes. Users can configure key parameters including moving average periods, ADX settings, volatility source, minimum bars for regime confirmation, volume filter settings, and alert options. The regime reading can be used to filter signals from other indicators or adapt trade management strategies, such as adjusting stop-loss distances or profit targets based on the prevailing market environment. The indicator requires sufficient historical data to initialize and is sensitive to parameter settings, which should be optimized for each market and timeframe. It is designed to support trading across Forex, indices, and other markets.
指标配置
客户评价
0.0
评价:0
客户评价
该产品尚无评价。已经试过了?抢先告诉其他人!
讨论
常见问答
Forex
Indices
ATR
Bollinger
cTrader Store 提供的所有产品,包括交易机器人、指标和插件,均由第三方开发者提供,仅供信息参考和技术访问之用。cTrader Store 并非经纪商,不提供投资建议、个人推荐或任何未来业绩保证。
该作者的其他作品
!["[Stellar Strategies] Market Structure Breakout" 标识](https://cdn.ctrader.com/image/webp/bceec265-3247-4b11-915f-6295a29c106d_28465)
!["[Stellar Strategies] Market Session Ultimate" 标识](https://cdn.ctrader.com/image/webp/61ffd537-0125-4246-9e72-42eca1791d64_28232)
!["[Stellar Strategies] BOS Trend 1.0" 标识](https://cdn.ctrader.com/image/webp/6cdec0f1-0e97-4a82-a8a4-2b67aed54d38_25695)
!["[Stellar Strategies] Inside Bar with Signals" 标识](https://cdn.ctrader.com/image/webp/1d9e8bfa-3b2c-4440-bb37-5856902008a7_30683)
!["[Stellar Strategies] Wave Trend Pro" 标识](https://cdn.ctrader.com/image/webp/5f226fbb-245a-41cd-9cdd-b018257d5e6d_28617)
!["[Stellar Strategies] Smart ADX" 标识](https://cdn.ctrader.com/image/webp/af13b084-b6f6-41db-b7bc-c7e688b57b05_36929)
!["[Stellar Strategies] Linear Regression Candles 1.1" 标识](https://cdn.ctrader.com/image/webp/8b9cff9f-2431-46d2-b0ec-c7f55f4a4a6d_27918)
!["[Stellar Strategies] VBO" 标识](https://cdn.ctrader.com/image/webp/f034c012-94d4-445a-a01b-febd1cdedaef_36944)
!["[StellarStrategies] Scheduled Trade Executor" 标识](https://cdn.ctrader.com/image/webp/daefc6af-7eca-453e-878d-1b981be2c401_25646)
!["[Stellar Strategies] Candlestick Patterns Dashboard" 标识](https://cdn.ctrader.com/image/webp/ae8691a5-4884-4553-9bcc-64e16ac82a30_38344)
!["[Stellar Strategies] SP500 Gap Closure cBot 1.0" 标识](https://cdn.ctrader.com/image/webp/92c23fdc-4ad1-4e61-bdb5-c77f6ec8c539_27686)
!["[Stellar Strategies] QQE" 标识](https://cdn.ctrader.com/image/webp/e702104a-874c-4b39-97dd-fb34518d1015_27712)
猜您喜欢


价格
20.46M
交易量
8K
盈利点数
25
销售
4.33K
免费安装