present
Sign up and get $50 off your first purchase
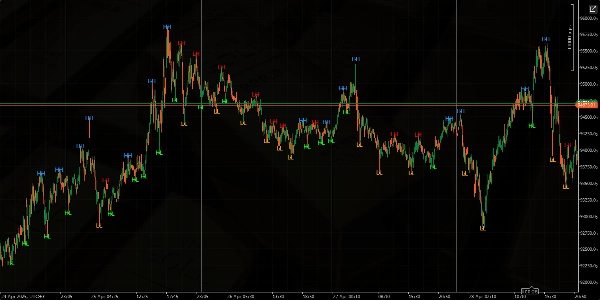
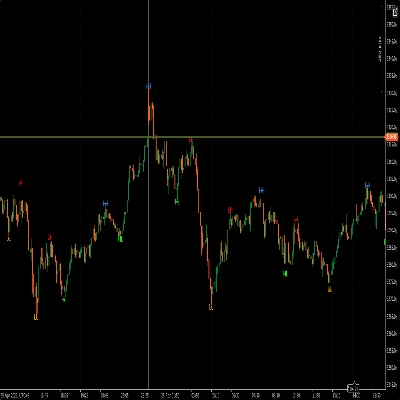
Trading product for Higher Highs Lower Lows Indicator, image 1
Higher Highs Lower Lows
Indicator
47 downloads
Version 1.0, Apr 2025
Windows, Mac
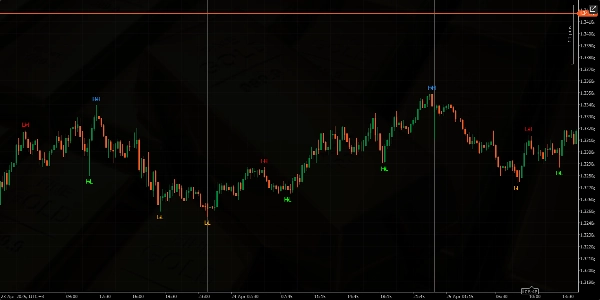
Trading product for Higher Highs Lower Lows Indicator, image 2
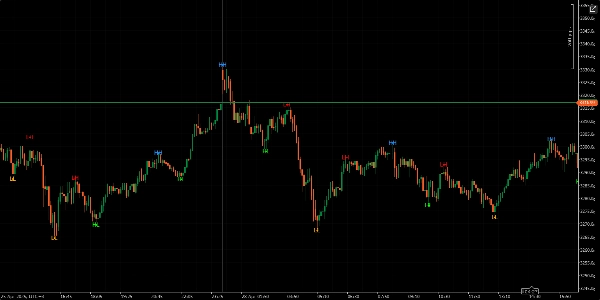
Trading product for Higher Highs Lower Lows Indicator, image 3
Trading product for Higher Highs Lower Lows Indicator, image 4
Trading product for Higher Highs Lower Lows Indicator, image 5
Since 16/03/2025
256
Free installs

Description

Summary

AI summary
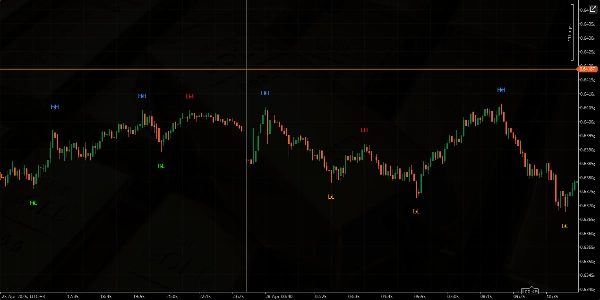
Higher Highs Lower Lows is a technical indicator designed to automatically detect and mark key market structure points on trading charts. It identifies and highlights higher highs, lower highs, higher lows, and lower lows, which are fundamental elements in analyzing price trends and market momentum. This indicator assists traders by visually marking these critical price levels, facilitating the assessment of market direction and potential trend reversals. It can be applied across various markets and timeframes to support technical analysis. Installation of the indicator enables automatic market structure recognition without manual plotting.
Indicator profile

Customer reviews

0.0
Reviews: 0
Customer reviews
No reviews for this product yet. Already tried it? Be the first to tell others!

Discussion

FAQ

Products available through cTrader Store, including trading bots, indicators and plugins, are provided by third-party developers and made available for informational and technical access purposes only. cTrader Store is not a broker and does not provide investment advice, personal recommendations or any guarantee of future performance.

More from this author
Indicator
ATR
RSI
+8
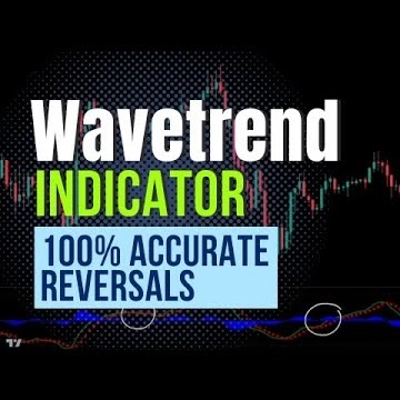
The WaveTrend Indicator is a multifunctional oscillator designed to center the trend wave or movements in the trend.

You may also like

Indicator
Forex
EURUSD
+5
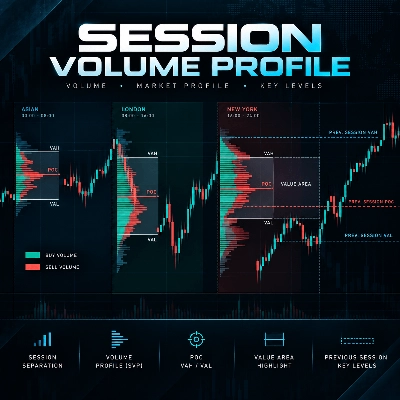
Session Volume Profile is a professional volume profile indicator for cTrader.
Indicator
Laguerre RSI: smoother, faster RSI with less noise. Great for spotting reversals and timing entries.
Indicator
Volume
Key Levels
+1
Fixed-grid volume profile: bull and bear volume at every price level, with Point of Control and value area.
Indicator
Area of Interest with the power of AI to detect the market interest.
Indicator
Forex
BTCUSD
+5
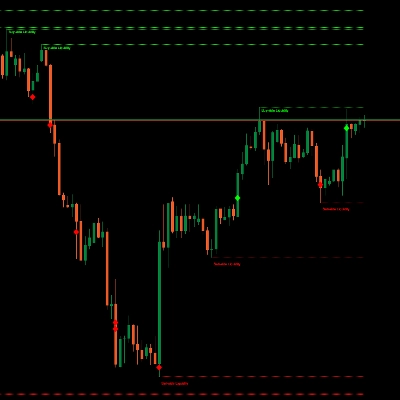
Buy-Side & Sell-Side Liquidity (BSL/SSL) Indicator
Indicator
Prop
Forex
+12
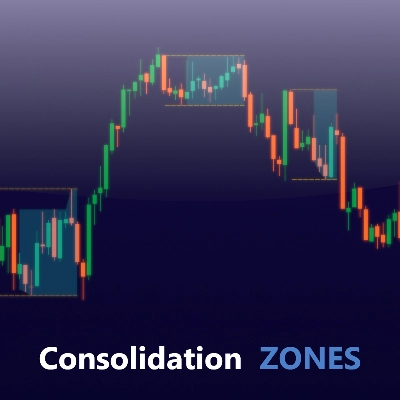
Identify and trade breakouts with Consolidation Zones! Visualize price consolidation areas for trading opportunities.
Indicator
Volume
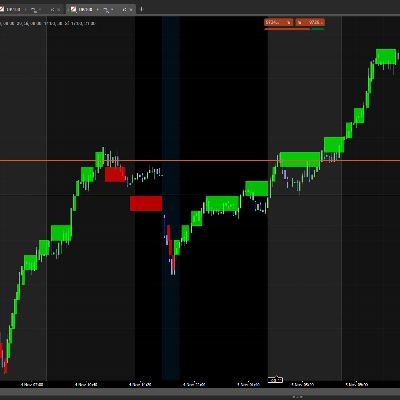
Custom range volume profile between two draggable anchors. Auto source timeframe, Total/Up-Down/Delta, POC, Value Area.
Indicator
Forex
Crypto
+2
HTF Candle
Indicator
ATR
SMC
+18
Super Wick detects powerful candle rejections: fractal long-wicks, HTF resonance zones, and a WSI gauge.
Indicator
Prop
Forex
+11
🌊 See when the market is truly in play. Tsunami measures Relative Volume by time-of-day 🌊
Indicator
Volume
Liquidity Sweep
+1
Liquidity Profiler Tools
Indicator
The Mean Reversion Indicator is designed to identify potential reversal points in the market.
Indicator
BOS
MSS
+5
Your entire ICT session map, structure engine, and key levels — No manual work. One indicator. Every session!
Indicator
MSS
Volume
+3
Rejection-based volume profile with tiered heat zones, POC levels and a fully draggable anchor on cTrader.
Indicator
ATR
RSI
+5
Supply and demand zones with break of structure, higher timeframe MA signals, a percent stop and three targets.
Indicator
EMA
VWAP
+2
ORB Range Indicator maps the opening range and gives a practical session-breakout workflow with clear labels.
Indicator
SMC
Forex
+1
Customizable cTrader indicator for marking trading sessions with vertical lines.
Indicator
BOS
Volume
+5
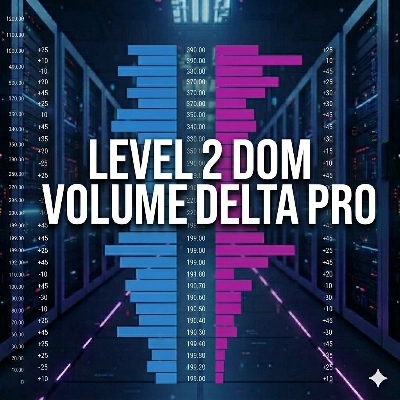
The Volume Delta Indicator using Institutional Level 2 DOM Data, The Edge Institutions Pay Millions For, now on cTrader

Price

Since 16/03/2025
256
Free installs