
PivotLevels
Indicateur
1 achats
Version 1.0, Sep 2025
Windows, Mac
4.5
Avis : 2
Description
Indicateur de Points Pivot
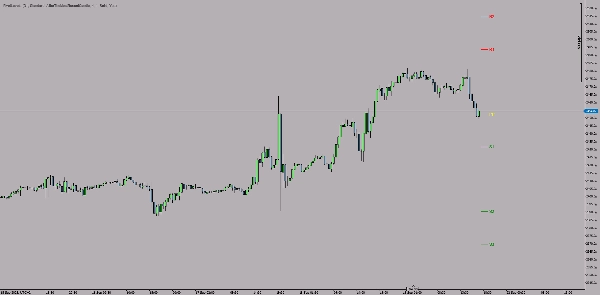
Le Pivot Points est un indicateur technique pour la plateforme cTrader qui calcule automatiquement et affiche les points pivots sous forme de lignes de tendance sur le graphique.
Caractéristiques principales :
🎯 Types de Pivot :
- Points Pivot Standard
- Points Pivot de Fibonacci
- Points Pivot de Woodie
- Points Pivot de Camarilla
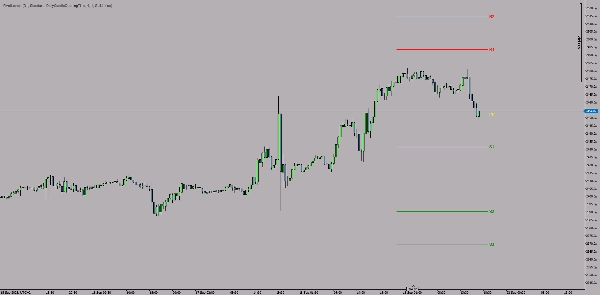
📊 Niveaux :
- Point Pivot Central (PP) - jaune
- Niveaux de résistance (R1, R2, R3) - rouge
- Niveaux de support (S1, S2, S3) - vert
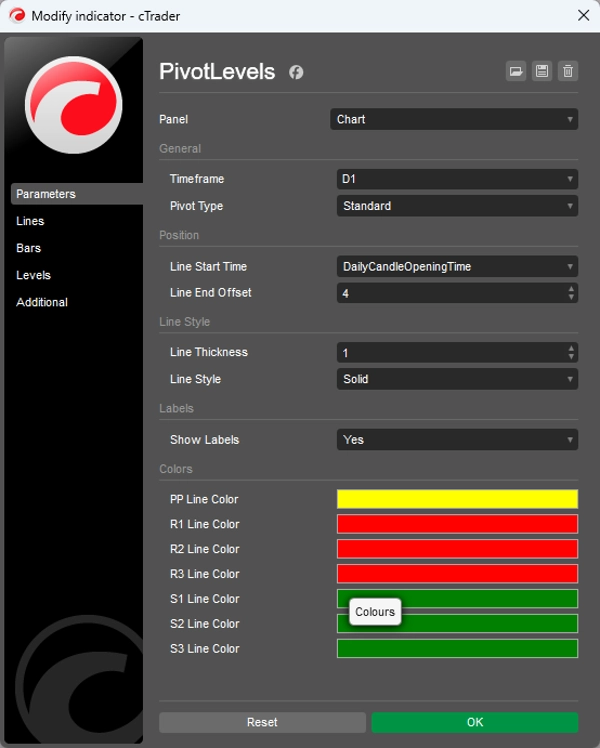
⚙️ Paramètres personnalisables :
- Période : Sélection quotidienne, hebdomadaire ou autre
- Style de ligne : Épaisseur (1-5) et type (plein, pointillé, etc.)
- Positionnement : Heure de début et longueur de la ligne
- Couleurs : Couleur de chaque niveau ajustable individuellement
- Étiquettes : Activer/désactiver les étiquettes de texte
💡 Utilisation :
L'indicateur calcule les niveaux pivots basés sur les valeurs haut, bas, clôture (et ouverture) de la période précédente (jour/semaine), ce qui permet d'identifier les zones clés de support et de résistance pour la prochaine période de trading.
Idéal pour les traders swing et day traders qui appliquent des stratégies basées sur les niveaux techniques.
Résumé
Résumé IA
PivotLevels is a technical indicator for the cTrader platform that automatically calculates and displays pivot points as trendlines on trading charts. It supports multiple pivot point calculation methods, including Standard, Fibonacci, Woodie, and Camarilla pivots. The indicator plots key levels such as the Central Pivot Point (PP) in yellow, resistance levels (R1, R2, R3) in red, and support levels (S1, S2, S3) in green.
Users can customize various settings, including the timeframe for pivot calculation (daily, weekly, or others), line style (thickness and type), line positioning (start time and length), colors for each level, and the option to toggle text labels on or off. The pivot levels are derived from the previous period’s high, low, close, and open prices, helping identify potential support and resistance zones for the upcoming trading period.
This indicator is suitable for traders who use technical levels in their strategies, particularly swing and day traders. It supports multiple markets such as forex, indices, commodities, cryptocurrencies, and stocks.
Profil de l'indicateur
Avis clients
4.5
Avis : 2
5 | 50 % | |
4 | 50 % | |
3 | 0 % | |
2 | 0 % | |
1 | 0 % |
Avis clients
September 30, 2025
The review gets easier when the decision feels less rushed, and The setup needs patience.
Discussion
Questions fréquentes
Prop
Forex
Indices
Commodities
Crypto
Stocks
Les produits disponibles sur cTrader Store, notamment les bots de trading, les indicateurs et les plug-ins, sont fournis par des développeurs tiers et mis à disposition à titre informatif et à des fins d'accès technique uniquement. cTrader Store n'est pas un courtier et ne fournit aucun conseil en investissement, aucune recommandation personnelle ni aucune garantie quant aux performances futures.


Prix
Depuis le 05/01/2025
14
Ventes