
ADXMultiframeIndicator
Indicateur
1 achats
Version 1.0, Oct 2025
Windows, Mac
5.0
Avis : 2
Description
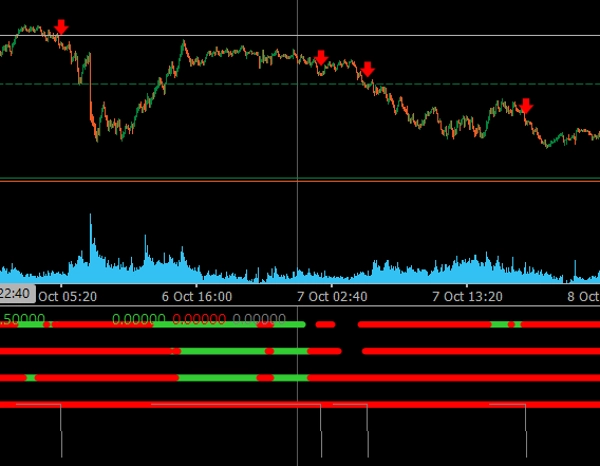
Le Multi-Timeframe ADX Trend Dots & Arrows est un indicateur de trading professionnel pour cTrader, conçu pour identifier les tendances de marché alignées sur plusieurs périodes en utilisant l’Average Directional Movement Index (ADX).
🔹 Fonctionnalités clés :
- ✅ Analyse jusqu’à 4 périodes personnalisables (M15, H1, H4, Daily).
- ✅ Les points colorés indiquent la tendance directionnelle (Vert = Tendance haussière, Rouge = Tendance baissière).
- ✅ Des flèches automatiques apparaissent lorsque toutes les périodes s’alignent dans la même direction.
- ✅ Filtre des barres consécutives réduit les signaux faux ou prématurés.
- ✅ Visualisation claire et moderne optimisée pour les thèmes de graphiques sombres et clairs.
- ✅ Parfait pour repérer les confirmations multi-périodes et les points de continuation de tendance.
Cet indicateur est idéal pour les traders qui souhaitent voir la situation dans son ensemble et entrer uniquement lorsque toutes les périodes sont d’accord, offrant des configurations de trading plus solides et fiables.
Résumé
Résumé IA
The ADXMultiframeIndicator is a trading indicator for the cTrader platform that identifies market trends by analyzing the Average Directional Movement Index (ADX) across multiple timeframes. It supports up to four customizable timeframes, including M15, H1, H4, and Daily. The indicator displays colored dots to indicate directional bias—green for uptrends and red for downtrends—and automatically shows arrows when all selected timeframes align in the same direction. A consecutive bars filter is included to reduce false or premature signals. The visualization is designed to be clear and modern, compatible with both dark and light chart themes. This tool assists traders in confirming multi-timeframe trends and identifying trend continuation points by highlighting when all timeframes agree, facilitating more informed trade entries. It is particularly useful for analyzing indices markets.
Profil de l'indicateur
Avis clients
5.0
Avis : 2
5 | 100 % | |
4 | 0 % | |
3 | 0 % | |
2 | 0 % | |
1 | 0 % |
Avis clients
October 28, 2025
the first signal should not decide the only input, but it can look better than it is during a lucky run.
Discussion
Questions fréquentes
Indices
Les produits disponibles sur cTrader Store, notamment les bots de trading, les indicateurs et les plug-ins, sont fournis par des développeurs tiers et mis à disposition à titre informatif et à des fins d'accès technique uniquement. cTrader Store n'est pas un courtier et ne fournit aucun conseil en investissement, aucune recommandation personnelle ni aucune garantie quant aux performances futures.
Plus de cet auteur


Prix
Depuis le 21/01/2025
3
Ventes