
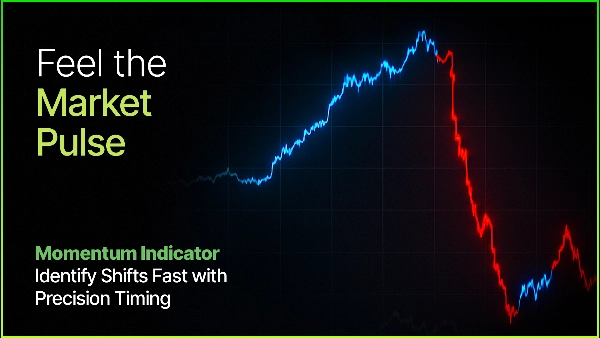
Description
Amplitude Momentum Label — Détection adaptative de tendance alimentée par la volatilité
Le label Amplitude Momentum unifie plusieurs concepts avancés :
- Détection de régime — Identifie les véritables phases de tendance
- Adaptation à la volatilité — S’ajuste automatiquement aux conditions actuelles du marché
- VWAP dynamique — Met en évidence les niveaux significatifs de retracement et de continuation
- Estimateur de roll spread — Signale les points de réentrée optimaux pendant les tendances
- MODULE D’OPTIMISATION — avec fonction d’auto-optimisation**
Cela crée un indicateur intelligent et auto-ajustable qui offre clarté, adaptabilité et zones de trading exploitables — sans ajustements manuels constants.
Qu’est-ce que c’est ?
Le label Amplitude Momentum est un indicateur de détection de régime qui identifie quand le marché entre ou sort des phases de momentum haussier ou baissier — en temps réel.
Contrairement aux croisements de moyennes mobiles traditionnels, il mesure les véritables changements de momentum en évaluant le déplacement des prix et la force des retournements.
La question centrale
Le marché est-il actuellement en phase de momentum — et dans quelle direction ?
Pour répondre à cela, l’indicateur suit :
- Amplitude — la distance parcourue par le prix ;
- Séquence — l’ordre dans lequel les hauts et les bas se produisent.
Un mouvement fort suivi d’un retournement significatif marque le début d’un nouveau régime de momentum.
Comment ça fonctionne
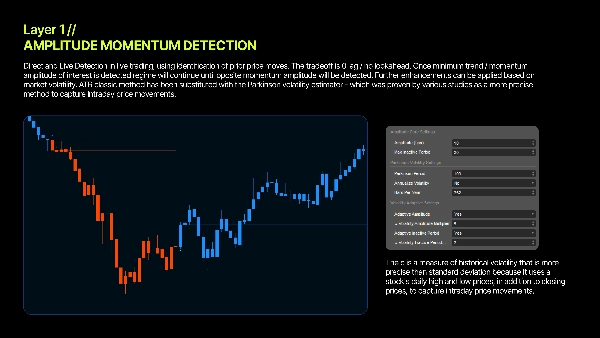
1. Mesurer le swing
L’indicateur met constamment à jour les extrêmes de prix les plus hauts et les plus bas.
Leur différence — amplitude — définit la taille actuelle du swing du marché.
2. Détecter le retournement
- Une forte baisse suivie d’un rallye puissant → **Momentum haussier**
- Une forte hausse suivie d’une forte baisse → **Momentum baissier**
3. Confirmer la signification
Seuls les retournements dépassant un seuil ajusté à la volatilité déclenchent un signal valide.
4. Détecter l’épuisement
Si le prix cesse de progresser, l’indicateur identifie un épuisement du momentum et revient à la neutralité.
Volatilité Parkinson — Seuils adaptatifs
La plupart des indicateurs utilisent des paramètres fixes. Celui-ci s’adapte automatiquement. En utilisant la volatilité Parkinson — qui intègre les plages haut/bas intrajournalières — l’indicateur ajuste sa sensibilité en fonction des conditions réelles du marché. Le résultat : une performance constante dans des environnements calmes et volatils. ( Statistiquement prouvé plus efficace que la méthode ATR )
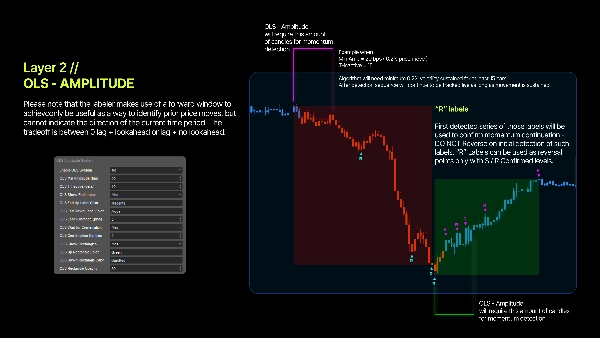
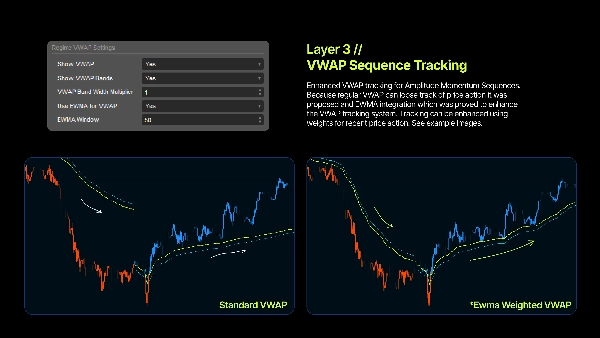
VWAP de régime — Niveaux dynamiques pour la réentrée
Une fois un régime actif, l’indicateur calcule un VWAP spécifique à cette tendance, fournissant des niveaux dynamiques de support et de résistance. Les institutions s’appuient fortement sur le VWAP, et le prix réagit souvent autour de celui-ci — ce qui le rend idéal pour les entrées sur retracement.
Mode EWMA
Activez EWMA pour pondérer davantage les prix récents, créant une courbe VWAP plus lisse et réactive. Excellent pour identifier les réentrées lors de tendances prolongées.
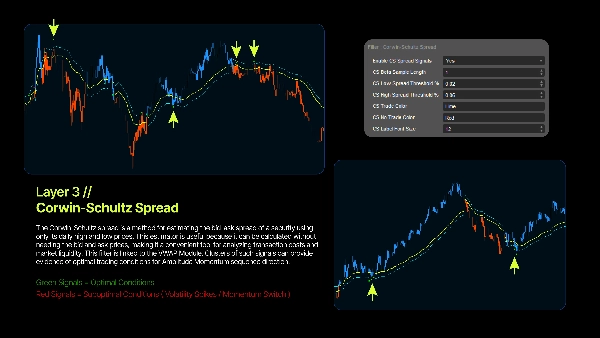
Estimateur de roll spread - Filtre dynamique pour la réentrée
Un estimateur de roll spread est une méthode pour estimer le spread bid-ask à partir des prix observés des transactions, utilisant généralement la covariance en série des variations de prix. Développé par Roll, il suppose que les transactions successives alternent entre les prix bid et ask, et que les nouvelles informations ne déplacent pas constamment le prix "réel". Bien que simple et fondamental, la méthode originale a été affinée pour résoudre des problèmes tels que le biais à la baisse et la mauvaise performance sur certains ensembles de données. L’estimateur repose sur l’idée que si aucune nouvelle information n’est publiée, les prix rebondiront simplement entre le bid et l’ask. Il suppose une probabilité égale d’une transaction initiée à l’achat et d’une transaction initiée à la vente.
Avantages d’utilisation
1. Identification objective de la tendance - Pas de lignes de tendance. Pas de conjectures. Les mathématiques définissent le régime.
2. Adaptatif à la volatilité - S’ajuste automatiquement aux conditions changeantes grâce à la volatilité Parkinson.
3. Zones d’entrée claires - Les niveaux VWAP de régime aident à cibler des zones intuitives de retracement et d’ajout.
4. Limites de régime définies - Sachez exactement quand le momentum commence et quand il se termine.
5. Compatibilité multi-échelles temporelles - La normalisation en points de base assure un comportement cohérent sur n’importe quel graphique.
La base quantitative
Rendements logarithmiques
L’utilisation des rendements logarithmiques garantit la symétrie, rendant la mesure du momentum mathématiquement robuste.
Points de base
Tous les calculs utilisent des unités standardisées en points de base (1 pb = 0,01 %), permettant une cohérence inter-actifs.
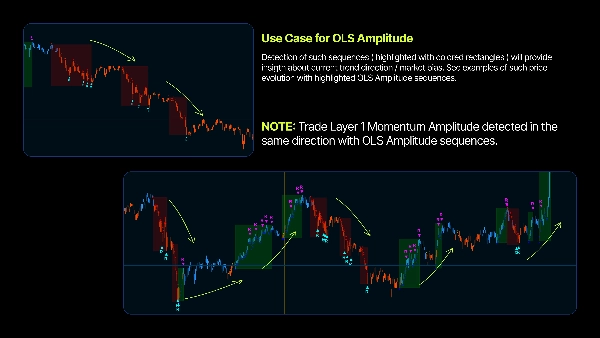
Détection de retracement
Les changements de momentum sont identifiés par des mouvements directionnels forts suivis de contre-mouvements significatifs (retournements en V).
Volume synthétique
Un volume synthétique basé sur la plage et le corps assure la précision du VWAP pour tout symbole.
⎽⎽⎽⎽⎽⎽⎽⎽⎽⎽⎽⎽⎽⎽⎽⎽⎽⎽⎽⎽⎽⎽⎽⎽⎽⎽⎽⎽⎽⎽⎽⎽⎽⎽⎽⎽⎽⎽⎽⎽⎽⎽⎽⎽⎽⎽⎽⎽⎽⎽⎽⎽⎽⎽⎽⎽⎽⎽⎽⎽⎽⎽⎽⎽⎽⎽⎽⎽⎽⎽⎽⎽⎽⎽⎽⎽⎽⎽⎽⎽⎽⎽⎽⎽⎽⎽⎽⎽⎽⎽⎽⎽⎽⎽⎽⎽⎽⎽⎽⎽⎽⎽⎽⎽⎽⎽⎽⎽⎽⎽⎽⎽
Cet outil est uniquement à des fins éducatives et informatives. Ce n’est pas un conseil en investissement. Le trading comporte des risques, et les pertes peuvent dépasser les dépôts. Les performances passées ne garantissent pas les résultats futurs. Vous êtes seul responsable de toutes les décisions de trading. Le créateur n’est pas responsable des pertes financières résultant de l’utilisation de cet indicateur. Effectuez toujours votre propre analyse avant de trader.
Résumé
Key features include:
- **Regime Detection:** Pinpoints market entry and exit points for momentum trends.
- **Volatility Adaptation:** Uses Parkinson Volatility to self-tune sensitivity based on current market conditions, ensuring consistent performance across varying volatility.
- **Dynamic VWAP:** Calculates a volume-weighted average price specific to each trend regime, providing dynamic support and resistance levels for pullback and continuation entries.
- **Roll Spread Estimator:** Estimates bid-ask spreads to signal optimal re-entry points during trends.
- **Self-Optimization Module:** Automatically adjusts parameters without manual intervention.
The indicator operates by continuously tracking price extremes to measure swing amplitude, detecting significant reversals that exceed volatility-adjusted thresholds, and identifying momentum exhaustion when price progression stalls. It uses logarithmic returns and basis-point normalization for mathematically robust, cross-asset consistency. Synthetic volume calculations enhance VWAP accuracy across symbols.
This tool supports multiple markets including Forex, stocks, indices, commodities, and cryptocurrencies, and is compatible with various timeframes. It outputs visual signals and filters to assist traders in objective trend identification and clear entry zone determination.
Avis clients
5 | 75 % | |
4 | 25 % | |
3 | 0 % | |
2 | 0 % | |
1 | 0 % |


