Description
L'oscillateur de flux de prix PFO est un outil d'analyse technique conçu pour fournir aux traders une vue structurée du momentum et de la volatilité du marché. Il combine plusieurs facteurs de marché en un seul oscillateur normalisé, permettant aux utilisateurs d'interpréter plus clairement l'action des prix dans différentes conditions. L'indicateur est gratuit et peut être appliqué au Forex, aux matières premières, aux indices et à d'autres actifs.
Comment ça fonctionne
L'oscillateur PFO calcule une valeur normalisée (0–100) basée sur :
ATR (Average True Range) : ajuste les lectures en fonction de la volatilité du marché.
Moyennes mobiles (EMA/SMA) : fournissent une base de tendance pour la comparaison du momentum.
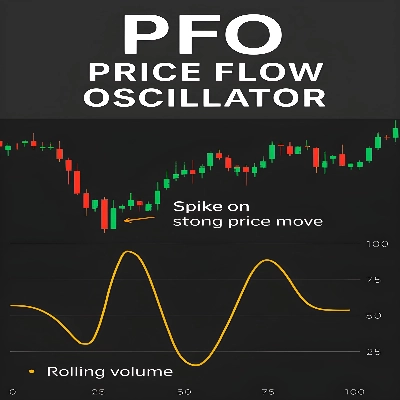
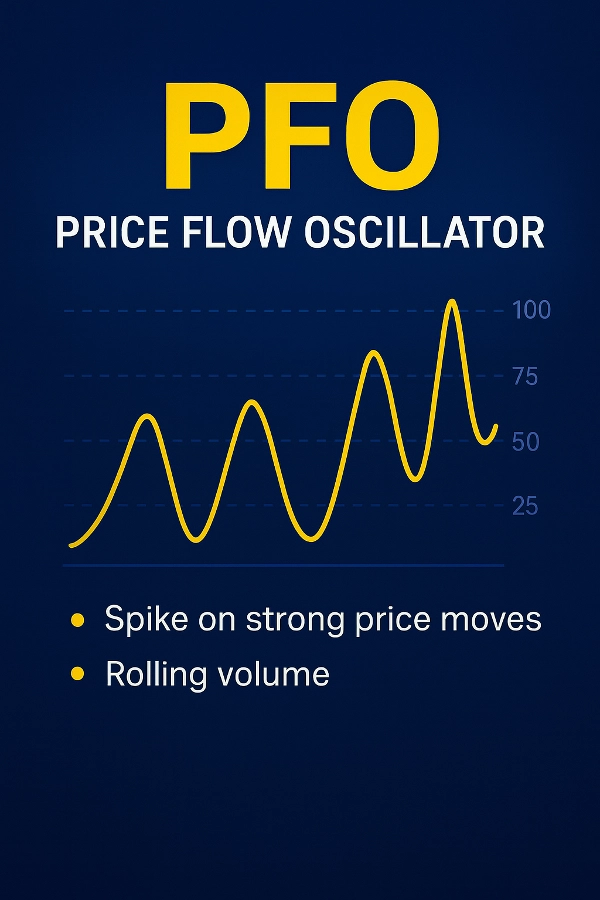
Analyse du volume : compare l'activité actuelle aux moyennes mobiles pour mettre en évidence des mouvements plus forts.
Facteurs d'action des prix :
Taille du corps vs. plage (force du chandelier).
Analyse des mèches (pression d'achat/vente).
Biais directionnel (mouvement haussier vs. baissier).
Momentum vs. ATR : mesure la déviation par rapport à la tendance relative à la volatilité.
Pondération des mouvements de prix : met en évidence les changements significatifs d'une barre à l'autre.
Lissage et normalisation : filtre le bruit et standardise les résultats sur une échelle de 0 à 100.
Lecture de l'oscillateur
Au-dessus de 75 : indique des conditions haussières plus fortes.
En dessous de 25 : indique des conditions baissières plus fortes.
Autour de 50 : suggère un comportement de marché neutre ou en consolidation.
Caractéristiques clés
Approche multifactorielle : intègre volatilité, tendance, volume et action des prix.
Valeurs lissées pour plus de clarté et réduction du bruit.
Échelle adaptative qui s'ajuste aux différentes conditions du marché.
Fonctionne sur plusieurs classes d'actifs et périodes.
Avertissement : cet indicateur est destiné uniquement à des fins d'analyse technique. Il ne prédit pas les performances futures ni ne garantit les résultats de trading. Les utilisateurs doivent le combiner avec leur propre analyse et leurs pratiques de gestion des risques.
Résumé
Avis clients
5 | 0 % | |
4 | 100 % | |
3 | 0 % | |
2 | 0 % | |
1 | 0 % |


