Market Bias Gauge
指标
242 下载
版本 1.0, Sep 2025
Windows 版、Mac 版
4.0
评价:2
说明
市场偏向测量指标
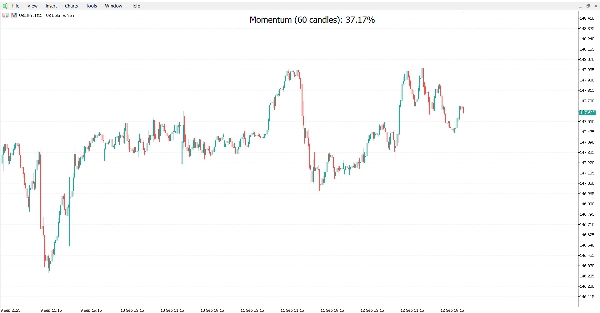
市场偏向测量是一种技术分析工具,旨在为交易者提供即时、清晰的市场动量视图,直接显示在图表上。与复杂的设置或杂乱的指标不同,该工具提供了一个强大的单一指标:您所选期间内多头与空头运动的百分比。
工具目的:
该工具旨在帮助您即时判断买方或卖方是否占据主导地位,从而帮助您做出更快、更自信的交易决策。
如何解读动量百分比:
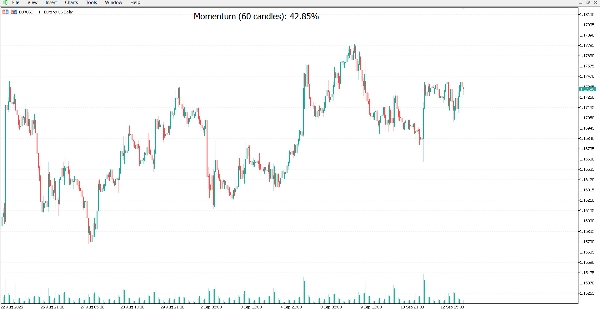
低于50%:表示空头动量占主导。卖方在所选期间内比买方更强,市场偏向下行。
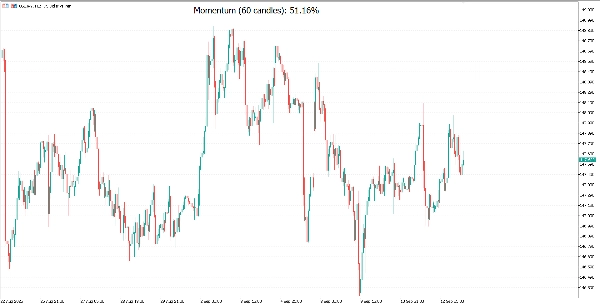
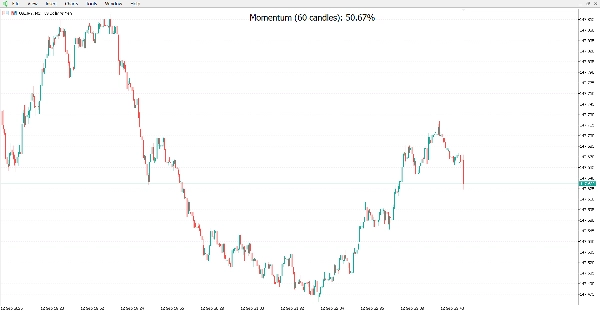
高于50%:表示多头动量占主导。买方在所选期间内比卖方更强,市场偏向上行。
恰好50%:表示市场平衡,没有明显的方向偏向。
功能:
即时动量读取:计算最近蜡烛(默认:60)中价格上涨与下跌的百分比。
清晰的图表显示:以大而易读的文字显示动量值,完美居中于您的图表上。
完全可定制外观:选择您喜欢的字体、大小和颜色,以匹配您的交易风格。
中性市场检测:当市场无净运动时,显示平衡的50%读数。
轻量且快速:即使在大型数据集或实时交易中也能流畅运行。
动态更新:每根新蜡烛自动刷新,让您与市场保持同步。
交易者喜爱的原因:
无需猜测:一目了然地看到市场偏向。
更好的时机把握:在传统指标出现之前发现动量变化。
完美搭档:与您现有策略协同工作,不增加图表杂乱。
免责声明
市场偏向测量是一种技术分析工具,仅用于信息和分析目的。该工具不提供财务或投资建议,也不保证盈利。金融市场交易涉及重大风险,可能导致资本损失。您对自己的投资决策负全责。您应将此工具作为包含风险管理的综合交易策略的一部分使用。
摘要
AI 摘要
The Market Bias Gauge is a technical analysis indicator that provides an immediate visual measure of market momentum on your chart. It calculates the percentage of bullish versus bearish price movements over a selected period (default 60 candles) and displays this value prominently on the chart. A reading above 50% indicates bullish dominance, below 50% signals bearish control, and exactly 50% reflects a balanced market with no clear bias. The indicator features a clear, customizable on-chart display with adjustable font, size, and color to suit individual preferences. It updates dynamically with each new candle, ensuring real-time momentum tracking. Designed to be lightweight and fast, it operates smoothly even with large datasets or during live trading. The Market Bias Gauge supports various markets including Forex, cryptocurrencies (e.g., BTCUSD, ETH), commodities (e.g., gold, oil), and indices (e.g., NASDAQ, S&P 500). It is intended to assist traders in quickly assessing whether buyers or sellers are in control, aiding faster and more confident decision-making without cluttering the chart. This tool complements existing strategies by providing a straightforward momentum signal based on price action.
指标配置
客户评价
4.0
评价:2
5 | 0 % | |
4 | 100 % | |
3 | 0 % | |
2 | 0 % | |
1 | 0 % |
客户评价
October 20, 2025
Quick glance, clear bias 🎯 - Market Bias Gauge nails market mood instantly. Simple, fast, and perfect as a trade filter!
讨论
常见问答
BTCUSD
Forex
Signal
Breakout
Scalping
Indices
EURUSD
Commodities
Crypto
AI
XAUUSD
MACD
cTrader Store 提供的所有产品,包括交易机器人、指标和插件,均由第三方开发者提供,仅供信息参考和技术访问之用。cTrader Store 并非经纪商,不提供投资建议、个人推荐或任何未来业绩保证。
该作者的其他作品


价格
注册日期 13/09/2025
27
销售
5.41K
免费安装