

说明
一个清晰的市场结构系统,显示 价格缺口、订单区块 和 基于突破的信号,可选的 成交量确认 和 重测警报。为标准图表和Renko图的清晰度而构建。
该指标专注于 可读性和执行,而非杂乱。区域会向前延伸并自动管理(过期/失效),帮助您在价格展开时跟踪重要水平。
它检测的内容
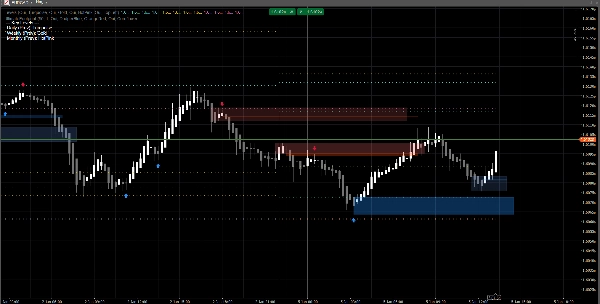
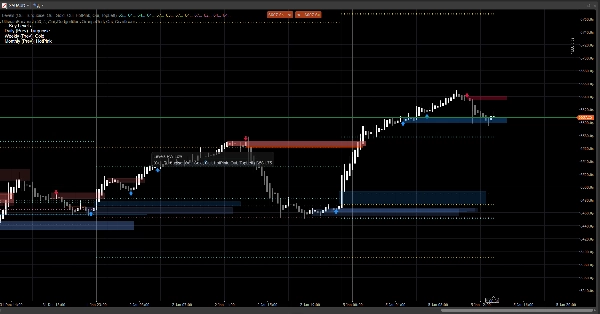
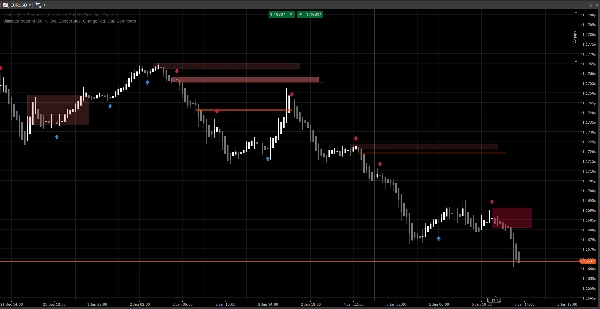
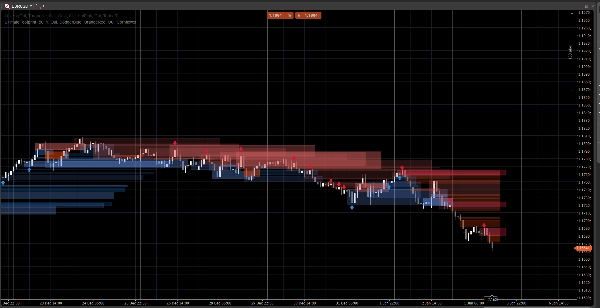
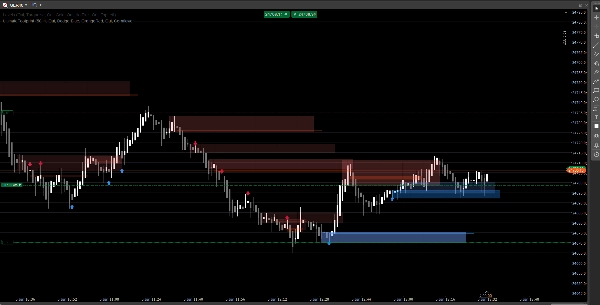
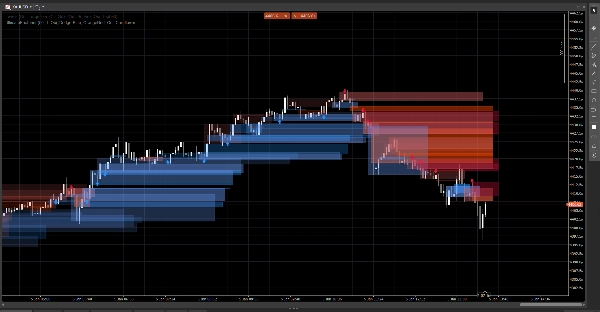
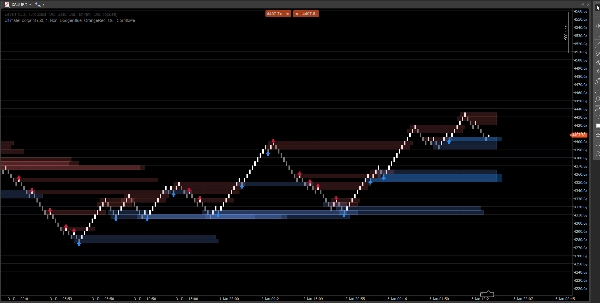
价格缺口(3根K线的低效区)
- 直接在图表上突出显示看涨和看跌缺口
- 可选显示(开关切换)
订单区块(位移前的最后一个相反蜡烛)
- 看涨和看跌的订单区块区域
- 自动向前延伸,直到失效或达到最大延伸
结构突破信号(摆动突破逻辑)
- 基于摆动高点/低点的突破检测
- 当确认新的订单区块时打印 信号箭头(向上/向下)
实时更新
- 设计用于在实时条件下平滑更新
- 适用于 经典蜡烛图,并且在 Renko风格价格行为上表现良好
智能过滤(可选)
成交量确认
- 您可以要求 成交量Z分数 确认后再验证订单区块信号
- 可调节的基线和灵敏度
警报(可选)
启用以下警报:
- 检测到新的订单区块
- 订单区块重测带方向(拒绝蜡烛)
如何使用(简单工作流程)
- 使用 价格缺口 和 订单区块 作为 反应区(关注区域)。
- 让 信号 突出结构突破和相应的订单区块形成。
- 使用 重测警报 捕捉带有拒绝行为的区域回归。
- 结合您自己的进出场策略(风险管理由您负责)。
输入概览
成交量逻辑
- 成交量基线:用于Z分数计算的平滑周期
- 成交量灵敏度:控制成交量对区域可见性的影响强度
价格缺口
- 显示价格缺口
- 看涨/看跌缺口颜色
订单区块
- 显示订单区块
- 看涨/看跌订单区块颜色
- 最大延伸:区域向前延伸的距离
信号
- 显示箭头
- 摆动回溯:定义摆动检测窗口
- 需要成交量确认(可选)
- 成交量阈值 + 成交量周期
- 信号颜色
- 区域透明度
- 最大延伸条数(信号)
警报
- 启用警报
- 新订单区块警报
- 重测警报
常见问题
1) 它会重绘吗?
不会。
该指标不会在K线关闭后将历史信号“移动”到新位置。
- 区域(缺口/订单区块矩形)是由 历史K线 创建,然后 向前延伸。
- 信号(箭头)是基于 已关闭K线条件(摆动突破+订单区块选择)确认的。
一旦箭头打印,就不会被事后重新定位。
重要细节(正常行为):
当 当前 K线仍在形成时,价格(最高/最低/收盘)可能会变化。这可能导致:
- 区域 更新其右边缘延伸(视觉延伸),
- 重测条件在 同一形成中的K线上可能暂时为真然后为假。
这 不是重绘——这是未完成蜡烛的实时更新。
2) 这里“重画”和“重绘”的区别是什么?
重画 = 是(设计如此)。
重绘 = 否。
- 重画 意味着矩形在图表上被重新绘制/延伸,使区域持续向未来投射。这是实时“足迹”风格叠加所必需的。
- 重绘 意味着指标会在事后更改过去确认的信号(箭头/区域)。这 不会 发生。
3) 为什么区域有时会改变形状或透明度?
因为区域是基于 成交量加权,使用 Z分数 模型:
SMA(volume)+StdDev(volume)在您的基线周期内- 透明度/Alpha随成交量偏差变化
所以如果您更改:
- 成交量基线
- 成交量灵敏度
- 或者符号数据源不同
视觉强度可能不同。区域的 位置 仍基于价格;可见性 可以反映成交量背景。
4) 为什么有时警报“缺失”或“关闭”?
有 3个技术原因,且都是有意为之:
A) 警报需要严格的汇合条件
对于 重测警报,指标要求:
- 价格重叠订单区块区域,且
- 满足拒绝蜡烛条件(例如:看涨拒绝要求
收盘价 > 开盘价)
如果价格触及区域但收盘持平/相反,不会触发重测警报。
B) 一次性警报逻辑(防垃圾邮件)
每个订单区块都有一个内部标志(例如: 已警报),以避免每个tick重复警报。
因此,如果首次触及未满足拒绝规则,后来满足但标志已设置(取决于您的版本),警报可能显示为“关闭”。
C) 图表类型行为(Renko / tick聚合)
在Renko图上,“当前砖块”不是经典蜡烛。形成过程中:
- 开盘/收盘可能不稳定或相等
- 重测逻辑可能在柱内发生但收盘时不确认
在实时交易中,为了最大可靠性:
- 新订单区块警报 通常是准确的
- 重测警报 最好视为“确认拒绝”警报(而非仅是影线触及)
5) 截图中:为什么有些订单区块没有显示箭头(或箭头不匹配每个订单区块)?
因为 区域和箭头不是同一个引擎:
- 区域(订单区块矩形) 可以由 区域检测逻辑 显示(基于缺口的订单区块/价格行为区域)。
- 箭头 仅在检测到 结构事件 时打印:
-
- 摆动高点/低点被突破(结构突破),
- 然后算法向后搜索找到 最后一个相反蜡烛 = 有效订单区块。
所以如果:
- 没有验证的摆动突破,
- 订单区块候选未通过成交量过滤(如果启用),
- 或者是由缺口引擎创建但未被结构引擎确认的区域,
您可能会看到没有箭头的订单区块区域。
这正是该工具有用的原因:
区域为您提供地图。箭头突出显示最高汇合点。
6) 我能强制订单区块总是匹配箭头吗?
是的,技术上您可以通过禁用不需要的区域层以“仅信号”模式运行:
- 关闭 价格缺口,如果您只想要结构驱动的区域
- 关闭 显示订单区块(区域),如果您只想要箭头确认的订单区块
7) 它适用于所有时间框架和品种吗?
是的,但结果取决于:
- 波动性,
- 流动性,
- tick成交量质量,
- 以及市场交易时段。
加密货币和指数的表现与外汇不同。
备注与免责声明
该指标是一个 视觉决策支持工具,不是信号服务,也不是财务建议。
所有市场和时间框架表现不同——请始终在您的数据上验证并适当管理风险。过去的表现不保证未来结果。
摘要
客户评价
5 | 100 % | |
4 | 0 % | |
3 | 0 % | |
2 | 0 % | |
1 | 0 % |


