
Price Projection Swing Volume
指标
324 下载
版本 1.0, Feb 2026
Windows 版、Mac 版
说明
🚀价格预测摆动量:📈
https://chartshots.spotware.com/c/6980f0f0287fb
价格预测摆动量是一种高级预测工具,旨在基于最近的价格摆动和斐波那契谐波比率绘制资产最可能的未来路径。它识别当前的市场区间,并为潜在的价格走势投射多阶段的“路线图”。
🔍 市场分析与条件
https://chartshots.spotware.com/c/6980f104dab21
该算法专注于通过分析识别“市场包络线”:
- 极端摆动点: 它扫描特定的回溯周期(例如,最近50根柱)以找到绝对的最高点和最低点。
- 回撤区间: 它自动计算并绘制当前摆动中的五个关键斐波那契水平(23.6%、38.2%、50%、61.8%和78.6%),以识别关注区域。
- 谐波投影: 使用投影比率(默认0.618),算法基于最近摆动点的测量移动计算出三段未来路径。
🟢 如何解读信号与视觉效果
https://chartshots.spotware.com/c/6980f126d875a
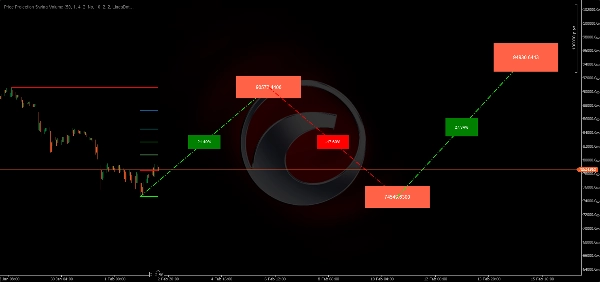
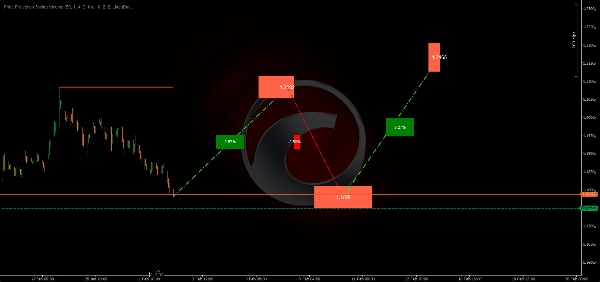
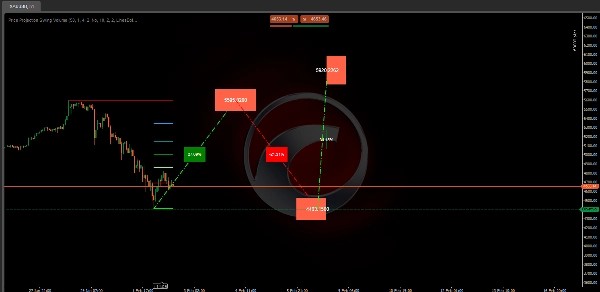
- 水平摆动线: 粗红色(高点)和绿色(低点)线代表当前市场边界。价格突破这些线通常预示趋势转变。
- 投影路径(虚线): 斜线预测“之字形”移动。这是算法对价格如何移动以达到最终目标的预测。
- 百分比标签: 位于斜线上,显示该段移动的预期百分比涨跌。
- 目标价格框: 每段末端的彩色框显示算法的精确价格水平。
⚙️ 关键设置与参数
- 回溯周期(50): 决定摆动的规模。较大数值寻找“宏观”摆动,较小数值关注“微观”剥头皮摆动。
- 投影比率(0.618): 这个“黄金比例”决定预测之字形的深度和高度。您可以调整以获得更激进或更保守的目标。
- 视觉自定义: 完全可调的多头/空头投影颜色及特定斐波那契水平,以匹配您的图表主题。
🚀 典型使用场景与情境
- 目标设定: 使用预测价格框设置摆动交易的止盈水平。
- 预期反转: 如果投影显示在上升前有深度回撤,交易者可以等待价格触及“谷底”虚线后再入场。
- 测量移动: 非常适合跟踪“ABCD”模式或谐波价格行为的交易者。
👤 目标交易者画像
- 摆动与趋势交易者: 适合持仓多日且需要潜在阻力路线图的交易者。
- 谐波交易者: 适合依赖斐波那契比率但希望自动完成计算的用户。
- 经验水平: 中级。交易者应理解这些是预测,应结合其他确认信号使用。
⚠️ 重要限制与使用说明
- 动态更新: 如果在回溯窗口内产生新的高点或低点,预测和摆动水平将实时“移动”。
- 初始化: 指标需要至少等于回溯周期的历史数据量,才能开始准确绘制。
摘要
AI 摘要
Price Projection Swing Volume is an advanced indicator designed for swing and trend traders to forecast potential future price movements. It analyzes recent price swings within a user-defined lookback period (default 50 bars) to identify extreme swing points—the highest highs and lowest lows—and calculates key Fibonacci retracement levels (23.6%, 38.2%, 50%, 61.8%, 78.6%) within the current market range. Using a harmonic projection ratio (default 0.618), it generates a three-segment zigzag projection path that maps likely price targets.
The indicator visually displays horizontal swing boundary lines (red for highs, green for lows), dotted diagonal projection lines with percentage gain or loss labels, and target price boxes indicating exact projected price levels. These features help traders set take profit targets, anticipate retracements or reversals, and identify measured moves consistent with harmonic patterns.
Key customizable settings include the lookback period for swing scale, projection ratio for target aggressiveness, and visual color options for bullish/bearish projections and Fibonacci levels. The indicator updates dynamically as new highs or lows form within the lookback window and requires sufficient historical data to initialize.
Price Projection Swing Volume supports multiple markets including BTCUSD, EURUSD, GBPUSD, NZDUSD, XAUUSD, NAS100, and USDJPY, making it suitable for traders using Fibonacci-based harmonic strategies and swing trading approaches.
指标配置
客户评价
0.0
评价:0
客户评价
该产品尚无评价。已经试过了?抢先告诉其他人!
讨论
常见问答
BTCUSD
Fibonacci
ZigZag
Scalping
EURUSD
GBPUSD
NZDUSD
XAUUSD
NAS100
USDJPY
cTrader Store 提供的所有产品,包括交易机器人、指标和插件,均由第三方开发者提供,仅供信息参考和技术访问之用。cTrader Store 并非经纪商,不提供投资建议、个人推荐或任何未来业绩保证。


猜您喜欢


!["Smart Money Concepts (SMC) [Iridio Capital]" 标识](https://cdn.ctrader.com/image/webp/28b69fd1-ef54-4bed-9487-07e78e883be4_40934)


价格
注册日期 03/10/2024
163
销售
39.21K
免费安装