
Opis
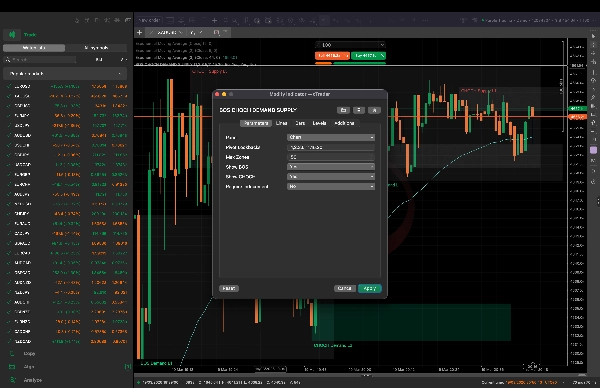
SMC BOS CHOCH PRO to zaawansowany wskaźnik Smart Money Concept (SMC) zaprojektowany, aby pomóc traderom precyzyjnie identyfikować kluczowe zmiany struktury rynku oraz strefy handlu instytucjonalnego.
Ten wskaźnik automatycznie wykrywa Break of Structure (BOS) oraz Change of Character (CHOCH), aby podkreślić kontynuację trendu i potencjalne odwrócenia. Dynamicznie rysuje strefy podaży i popytu oparte na zweryfikowanym ruchu cenowym, pozwalając traderom dostrzec obszary wejścia o wysokim prawdopodobieństwie.
Korzystając z wielu okresów cofania pivotów, wskaźnik zapewnia wielowarstwowy widok struktury rynku, pomagając traderom dostosować się zarówno do krótkoterminowych, jak i długoterminowych trendów na jednym wykresie.
🔑 Kluczowe cechy
- Automatyczne wykrywanie BOS (kontynuacja trendu) oraz CHOCH (odwrócenie trendu)
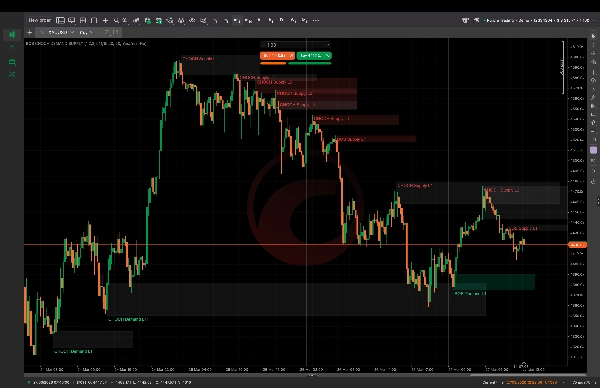
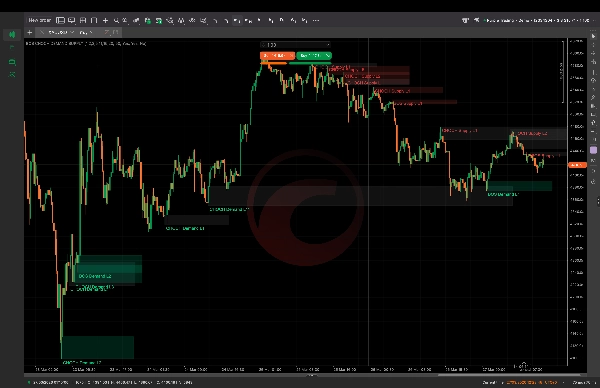
- Rysowanie w czasie rzeczywistym stref podaży i popytu
- Śledzenie łagodzenia stref (strefy zmieniają się po retestach)
- Automatyczne usuwanie nieprawidłowych/uszkodzonych stref
- Analiza struktury na wielu interwałach czasowych z wykorzystaniem wielu cofnięć pivotów
- Czysta i intuicyjna wizualizacja wykresu
- Filtrowanie zduplikowanych stref dla lepszej czytelności
📊 Jak to działa
- Identyfikuje lokalne maksima i minima za pomocą logiki pivotów
- Wykrywa przełamania struktury, gdy cena zamyka się powyżej/poniżej kluczowych poziomów
- Klasyfikuje ruchy jako BOS lub CHOCH na podstawie poprzedniej struktury
- Rysuje strefy od ostatniej przeciwnej świecy przed ruchem
- Dynamicznie aktualizuje strefy w miarę interakcji ceny z nimi
🎯 Najlepsze zastosowania
- Trading intraday (Forex, złoto, indeksy)
- Skalpowanie z potwierdzeniem struktury
- Trading kontynuacji i odwrócenia trendu
- Strategie Smart Money / Price Action
👤 Dla kogo jest ten wskaźnik
- Traderzy korzystający ze strategii SMC lub Price Action
- Początkujący chcący zrozumieć strukturę rynku
- Zaawansowani traderzy poszukujący automatycznego mapowania struktury
Podsumowanie
Key features include automatic detection of BOS and CHOCH, real-time plotting and dynamic updating of Supply & Demand zones, zone mitigation tracking after retests, removal of invalid or broken zones, and multi-timeframe structure analysis using multiple pivot lookbacks. It provides a clean, intuitive chart visualization with duplicate zone filtering for clarity.
The indicator works by identifying swing highs and lows through pivot logic, detecting structure breaks when price closes beyond key levels, classifying moves as BOS or CHOCH, and drawing zones from the last opposing candle before the move. Zones update dynamically as price interacts with them.
It is suitable for intraday trading in markets such as Forex, Gold (XAUUSD), and Indices, supporting strategies like scalping, trend continuation, reversal trading, and Smart Money/Price Action approaches. The tool is designed for traders using SMC or Price Action strategies, including beginners and advanced users seeking automated market structure mapping.
Opinie klientów
5 | 0 % | |
4 | 100 % | |
3 | 0 % | |
2 | 0 % | |
1 | 0 % |