
Mô tả
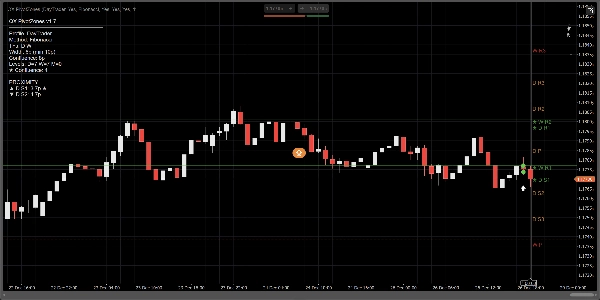
QX PivotZones là một chỉ báo Pivot Points được xây dựng cho các quyết định giao dịch thực tế, không chỉ là các đường tĩnh mà giá bỏ qua"
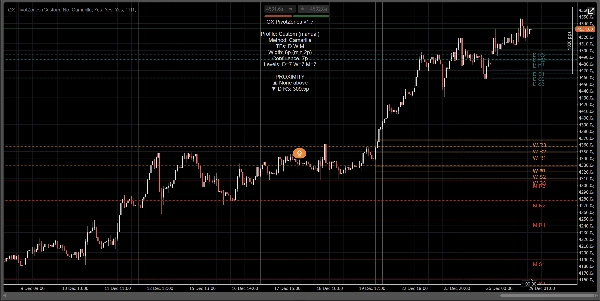
Nó tính toán Pivot hàng ngày, hàng tuần và hàng tháng sử dụng Classic, Fibonacci, Camarilla hoặc Woodie, và vẽ chúng dưới dạng các vùng giá thực sự (dải) với độ rộng có thể điều chỉnh (Pips hoặc dựa trên ATR). Lợi thế cốt lõi rất đơn giản: nó tự động làm nổi bật sự hội tụ đa khung thời gian và biến các pivot thành các khu vực có thể hành động, không phải “những ảo tưởng đường hoàn hảo”.
Tại sao nó khác với các công cụ Fibonacci Pivot / FiboPoints thông thường:
Hầu hết các chỉ báo “FiboPoints” chỉ dừng lại ở các đường pivot cơ bản. QX PivotZones bổ sung những gì các nhà giao dịch thực sự cần:
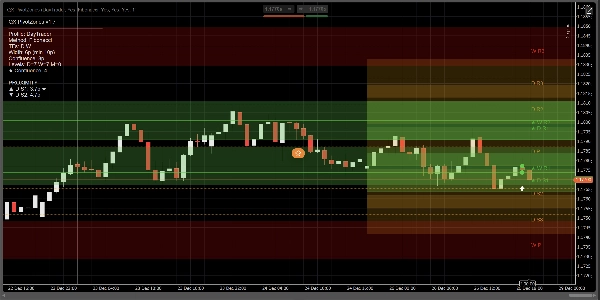
- Phát hiện hội tụ D/W/M tự động: khi các pivot từ các khung thời gian khác nhau tụ lại, mức đó được làm nổi bật (★) và tô màu bằng màu hội tụ.
- Vùng (Dải) thay vì các đường mảnh: xác định độ rộng bằng pips hoặc ATR. Điều này giảm nhiễu từ các phản ứng “gần chạm”.
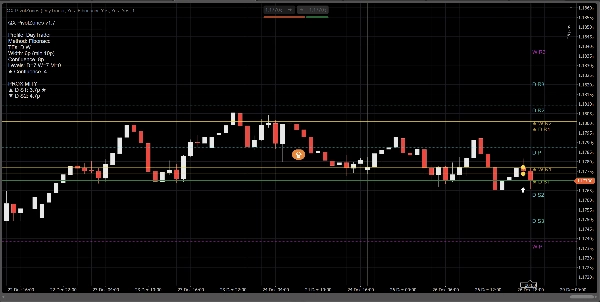
- Bộ lọc mức gần nhất (tùy chọn): chỉ hiển thị các vùng có liên quan nhất ở trên và dưới giá hiện tại.
- Cảnh báo hữu ích: kích hoạt khi Vào Vùng, Chạm Đường, hoặc Cả hai, với thời gian chờ và bộ lọc tùy chọn “Chỉ Hội tụ”.
- Bảng thông tin + Khoảng cách gần: xem các TF được bật, phương pháp, độ rộng vùng, số lượng hội tụ và khoảng cách đến vùng gần nhất ở trên/dưới.
Cách sử dụng:
1) Chọn một hồ sơ
- Scalper: trong ngày, ít mức hơn, vùng thích ứng chặt hơn.
- DayTrader: Hàng ngày + Hàng tuần (mặc định).
- Swing: Hàng ngày + Hàng tuần + Hàng tháng.
- Tùy chỉnh: kiểm soát thủ công mọi thứ.
Mẹo: Nếu bạn muốn “DayTrader + Monthly”, hãy tắt ghi đè hồ sơ (hoặc dùng Tùy chỉnh) và bật Hiển thị hàng tháng thủ công.
2) Cấu hình vùng (điểm chính)
Dưới Chế độ độ rộng vùng:
- Pips cho dải cố định, nhất quán.
- ATR cho dải thích ứng theo biến động.
Các tham số chính:
- Độ rộng vùng (pips) hoặc ATR k
- Độ rộng vùng tối thiểu (pips) để tránh dải quá mỏng
- Tô màu vùng để vẽ các vùng
- Mở rộng vùng sang phải để chiếu dải vào phía phải có thể nhìn thấy
3) Bật hội tụ (điểm khác biệt chính)
- Làm nổi bật hội tụ: BẬT
- Chế độ hội tụ:
-
- Pips cho dung sai cố định
- ATR cho dung sai thích ứng
- Khoảng cách hội tụ hoặc Confluence ATR k
Các mức hội tụ nhận được:
- Màu hội tụ
- Biểu tượng ★ trên nhãn
- Số lượng hiển thị trong bảng
4) Cảnh báo (giao dịch mà không cần nhìn chằm chằm vào màn hình)
- Cảnh báo: Vào Vùng, Chạm Đường, hoặc Cả hai
- Cảnh báo: Chỉ Hội tụ: giảm nhiễu
- Thời gian chờ cảnh báo (số thanh): ngăn chặn spam
- Hiển thị biểu tượng cảnh báo: đánh dấu sự kiện trên biểu đồ
Cài đặt nhanh (đề xuất)
Scalping (M5–M15)
- Chế độ độ rộng vùng: ATR
- ATR k: 0.15–0.25
- Chế độ hội tụ: Pips
- Khoảng cách hội tụ: 4–8 pips
- Chỉ vùng gần nhất: BẬT (3 trên / 3 dưới)
Giao dịch trong ngày (M15–H1)
- Chế độ độ rộng vùng: Pips
- Độ rộng: 6–10 pips
- Hội tụ: 8–12 pips
- Bật Hàng ngày + Hàng tuần
Swing (H4–D1)
- Chế độ độ rộng vùng: ATR
- ATR k: 0.25–0.45
- Bật Hàng ngày + Hàng tuần + Hàng tháng
Nó làm gì (và không làm gì)
- Đây không phải là bộ tạo tín hiệu mua/bán.
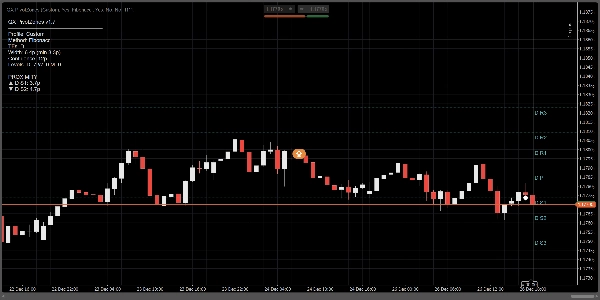
- Nó là một bản đồ cấu trúc thị trường / vùng S&R với cảnh báo sự kiện (vào/chạm) và làm nổi bật hội tụ.
- Các trường hợp sử dụng tốt nhất: phản ứng tại các pivot, từ chối/chấp nhận, hồi lại, mục tiêu, thoát dần, và bảo vệ giao dịch.
Tóm tắt
Đánh giá của khách hàng
5 | 100 % | |
4 | 0 % | |
3 | 0 % | |
2 | 0 % | |
1 | 0 % |


