
PDHL
Indicador
1.85K descargas
Versión 1.0, Sep 2024
Windows, Mac
2.5
Valoraciones: 2
Descripción
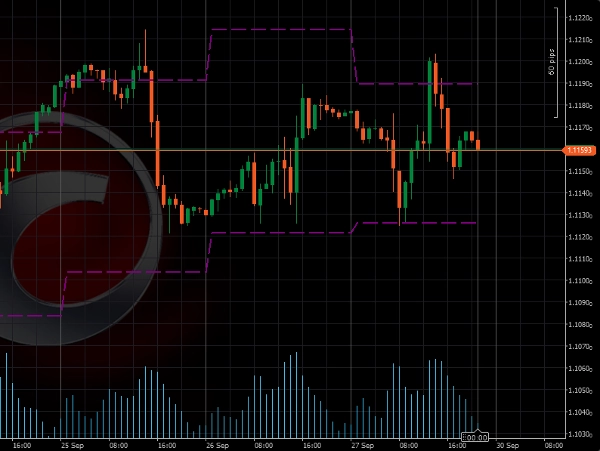
Presentando el Indicador de Trading High-Low
Este indicador está diseñado para trazar automáticamente los niveles de precio más alto y más bajo del día anterior en su gráfico. Esta herramienta le ayuda a identificar rápidamente niveles clave para posibles rupturas y reversiones.
Beneficios Clave:
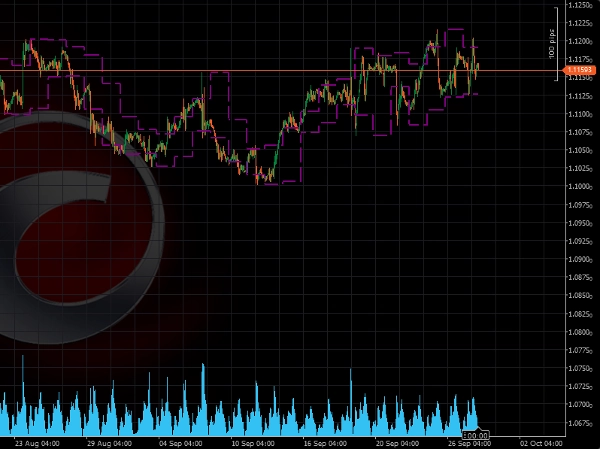
- Ideal para Trading de Rupturas: Este indicador resalta niveles críticos de precio del día anterior, que a menudo se usan como puntos de referencia para estrategias de ruptura. Operar rupturas por encima o por debajo de estos niveles puede ofrecer configuraciones de alto potencial.
- Simple pero Efectivo: El Indicador de Trading High-Low se enfoca en uno de los aspectos más importantes de la acción del precio: el máximo y mínimo del día anterior. Al incorporar estos niveles en su estrategia, obtiene una comprensión más clara de la estructura del mercado y de los posibles puntos de inflexión.
Atenciones:
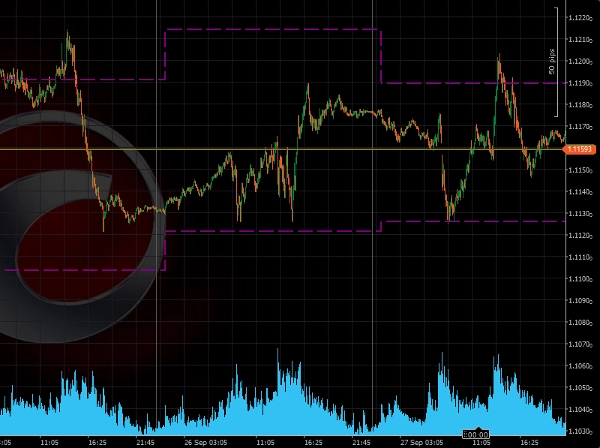
- Mejor utilizado en marcos temporales inferiores a 1 día
Configuraciones:
- Incluir domingo: por defecto = no
Resumen
Resumen de IA
The PDHL (Previous Day High & Low) indicator automatically plots the prior day's highest and lowest price levels on trading charts. It is designed to assist traders in identifying key price levels that may signal potential breakouts or reversals. By highlighting these critical levels, the indicator supports breakout trading strategies, providing reference points for entering trades when price moves above or below the previous day's range. The tool emphasizes simplicity and effectiveness by focusing on essential price action elements, helping traders better understand market structure and potential turning points. It is best used on intraday timeframes shorter than one day. A configurable setting allows users to include or exclude Sunday in the calculation, with the default setting excluding it.
Perfil del indicador
Valoraciones de clientes
2.5
Valoraciones: 2
5 | 0 % | |
4 | 0 % | |
3 | 50 % | |
2 | 50 % | |
1 | 0 % |
Valoraciones de clientes
October 9, 2025
What Timezone is it in at default? It seems to fail to get the accurate Highs and lOws for different istruments. You could add that as a customisable input. Please add closing price too
July 9, 2025
Pros: Simple and clear display of previous day's high/low levels. Stable performance. Easy to use and customize. Cons: No breakout alerts. No visual zone fill option. Lacks additional filters or Fibo levels.
Conversación
Preguntas frecuentes
Breakout
Los productos disponibles a través de cTrader Store, incluidos bots, indicadores y plugins para operar, son proporcionados por desarrolladores de terceros y están disponibles únicamente con fines informativos y de acceso técnico. cTrader Store no es un bróker, por lo que no proporciona asesoramiento de inversión, recomendaciones personales ni ninguna garantía de rentabilidad futura.
Más de este autor


Precio
Desde 24/09/2024
4.49K
Instalaciones gratis