present
Zarejestruj się i otrzymaj 50 $ zniżki na pierwszy zakup
Trading product for HIO RSI Multi Currency Scanner Pro Wskaźnik RSI Volume, image 1
HIO RSI Multi Currency Scanner Pro
Wskaźnik
Wersja 1.1, May 2026
Windows, Mac
4.7
Opinie: 4
Trading product for HIO RSI Multi Currency Scanner Pro Wskaźnik RSI Volume, image 2
Trading product for HIO RSI Multi Currency Scanner Pro Wskaźnik RSI Volume, image 3
Trading product for HIO RSI Multi Currency Scanner Pro Wskaźnik RSI Volume, image 4
Trading product for HIO RSI Multi Currency Scanner Pro Wskaźnik RSI Volume, image 5
Od 12/06/2025
1
Sprzedaż
399
Bezpłatne instalacje

Opis

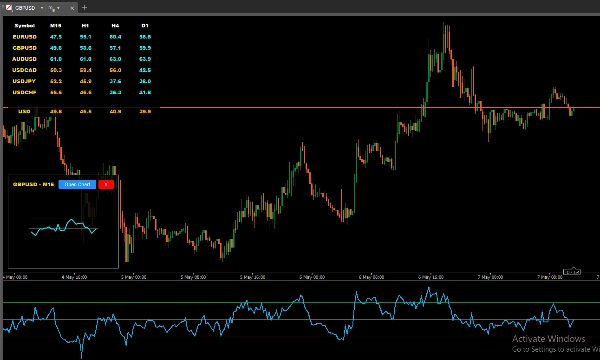
The HIO RSI Multi Currency Scanner Pro is an analytical dashboard designed to help you monitor market momentum. Instead of switching between multiple charts, this tool provides a consolidated view to track RSI levels across various symbols and timeframes simultaneously. It is built to assist traders in identifying market conditions efficiently.

Key Features

  • Currency Strength Integration: Calculates the weighted strength of a target currency based on RSI and volume across selected pairs.
  • Interactive Mini-Charts: Click any data cell to view an instant popup mini-chart of the RSI history without leaving your current workspace.
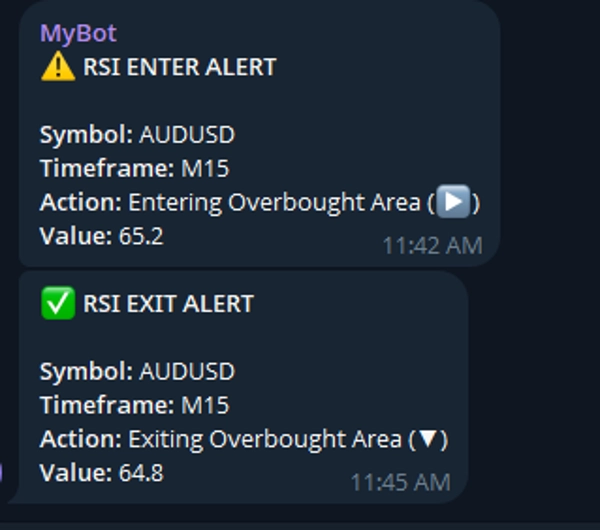
  • Smart Alerts: Get notified when RSI enters or exits specific extreme zones via messaging integration.
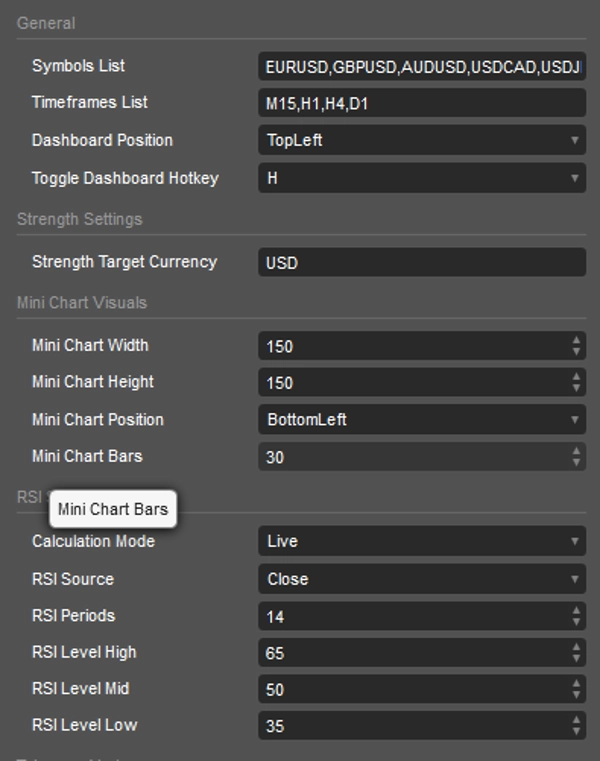
  • Dual Calculation Modes: Choose between Live for real-time tracking or BarClose for updates upon candle close.
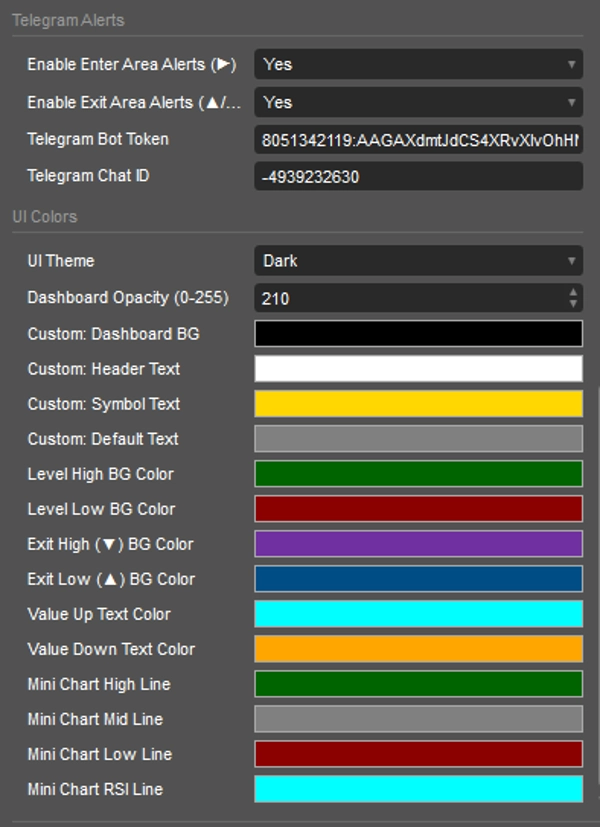
  • Customizable UI: Support for Dark, Light, and Custom themes with adjustable opacity and a dedicated hotkey to toggle dashboard visibility.

Visual Alerts & Color Logic

The dashboard uses an intuitive color-coding system to help you read market conditions quickly:

  • Background Colors (Zones):
    • Dark Green / Dark Red: RSI is currently in the Overbought / Oversold zone.
    • Purple / Blue: RSI has just exited the Overbought / Oversold zone.
  • Text Colors (Momentum): Aqua / Orange: The RSI value is rising / falling compared to the previous candle.
  • Directional Indicators: Text updates dynamically to indicate if RSI is entering or exiting the zones.

(Note: UI and text colors are fully customizable via the settings)

Setup & Parameters

  • General: Define your Symbols List and Timeframes List. Set the Dashboard Position and your preferred Hotkey.
  • RSI Core: Adjust RSI Periods, select the RSI Source, and set specific thresholds for High, Mid, and Low levels.
  • Strength Settings: Input your Target Currency to monitor its overall momentum.
  • Notifications: Input your settings to enable remote notifications for Enter or Exit alerts.

Elevate your trading routine with a tool designed for clarity. The HIO RSI Multi Currency Scanner Pro is built to optimize your multi-asset monitoring process.

Podsumowanie

Podsumowanie AI
The HIO RSI Multi Currency Scanner Pro is an analytical dashboard designed for monitoring Relative Strength Index (RSI) levels across multiple symbols and timeframes simultaneously. It consolidates market momentum data into a single interface, reducing the need to switch between charts. Key features include currency strength integration, which calculates weighted strength of a target currency based on RSI and volume across selected pairs. The tool offers interactive mini-charts accessible via clickable data cells, enabling quick RSI history review without leaving the workspace. It supports smart alerts that notify users when RSI enters or exits specified extreme zones through messaging integration. Users can select between live real-time tracking or updates upon candle close with dual calculation modes. The customizable user interface supports dark, light, and custom themes, adjustable opacity, and a hotkey to toggle dashboard visibility. Visual alerts use color-coded backgrounds and text to indicate RSI zones and momentum changes, with full customization available. Setup options allow defining symbols and timeframes, adjusting RSI parameters, setting target currencies for strength monitoring, and configuring remote notifications. This tool is intended to streamline multi-asset RSI monitoring for traders seeking a comprehensive momentum overview.
Profil wskaźnika
Kategoria wskaźnika
Dynamika
Typ wyjścia
Wizualizacja
Sygnały
Filtr
Wymagania dotyczące danych
Tylko słupki
Dane tickowe
Wolumen
Obsługiwane sygnały
Przecięcie
Odwrócenie trendu

Opinie klientów

4.7
Opinie: 4
5
75 %
4
25 %
3
0 %
2
0 %
1
0 %
Opinie klientów
May 20, 2026
A 12 trade note set is enough for first impressions. It keeps the review from getting sloppy.
May 18, 2026
H1 makes the signal less noisy. The setup gets an extra sanity check.
May 18, 2026
ngl, timing feels less random and that is enough to keep testing it. M15 is enough for the first pass.
May 15, 2026
No reason to yolo this live without a few normal sessions. It needs a few bad trades in the sample too.

Dyskusja

Częste pytania

RSI
Volume
Produkty dostępne za pośrednictwem cTrader Store, w tym boty handlowe, wskaźniki i wtyczki, dostarczane są przez deweloperów zewnętrznych i udostępniane wyłącznie w celach informacyjnych oraz w celu zapewnienia dostępu technicznego. cTrader Store nie jest brokerem i nie zapewnia doradztwa inwestycyjnego, nie udziela spersonalizowanych rekomendacji ani nie gwarantuje przyszłych wyników.

Więcej od tego autora

Wskaźnik
Forex
BTCUSD
+9
On-chart economic calendar with custom filters and automated Telegram alerts. Never miss high-impact news!
Wskaźnik
Forex
BTCUSD
+13
Multi-symbol Inside Bar Scanner with dashboard & breakout alerts
Wskaźnik
Forex
BTCUSD
+10
(ViPi) MTF Candle displays multiple higher timeframe candles right on your current chart for ultimate trend analysis.
Wskaźnik
Prop
Forex
+14
Pro Inside Bar Scanner with smart Telegram alerts & multi-timeframe dashboard
Wskaźnik
Volume
Stochastic
Multi-symbol & multi-timeframe Stochastic scanner with interactive mini-charts and Telegram alerts
Wskaźnik
CCI
Volume
Monitor multiple pairs and timeframes with this interactive CCI dashboard. Includes mini-charts & Alerts.
Wskaźnik
Key Levels
Display live economic events directly on your chart with impact filters and automated advance notifications.

Możesz także polubić

Wskaźnik
Key Levels
Support & Resistance
Clean psychological round-number grid with native pip and point auto-scaling across Forex, Gold, Indices, and Crypto.
Logo „macdZR”
Najwyżej oceniane
4.6
(5)
$19
Wskaźnik
MACD
Forex
+5
MACD ZERO LAG. Get faster signals, earlier trend detection, and eliminate the delay of traditional moving averages
Wskaźnik
Prop
Forex
+12
Identify and trade breakouts with Consolidation Zones! Visualize price consolidation areas for trading opportunities.
Wskaźnik
RSI
MACD
+7
The ZigZag indicator is a technical analysis tool primarily used to identify key price reversal points.
Logo „SupertrendChannels”
Najwyżej oceniane
4.7
(4)
$19
/
$20
Wskaźnik
Supertrend-based channel for entries, trailing stops, and dynamic support/resistance zones.
Wskaźnik
ATR
Key Levels
It combines the trend-filtering power of Renko charts with the volatility tracking of ATR Bands
Wskaźnik
Key Levels
Order Block
+5
Pixel-perfect trading zones in a click! Instantly draw, resize & color via hotkeys. Automate your charting routine
Wskaźnik
BOS
Key Levels
+1
Guided by Yahuah Yahusha. 15M: BOS above red (buys)/below green (sells). 4HC reject+BOS. 5M: RBS/SBR. SL wick. TP 1:4.
Wskaźnik
Volume
Liquidity Sweep
+1
Liquidity Profiler Tools
Wskaźnik
Spot Strong Trends Early & Filter Market Noise
Logo „VegaXLR - Fibonacci Bands”
Najwyżej oceniane
4.5
(4)
$20
Wskaźnik
Forex
Customizable Dynamic Fibonacci Channels and Smart Alerts
Wskaźnik
Prop
Forex
+5
🎯 Order Block Detector - Smart Trading: Identifica bloques de órdenes clave en cTrader para un trading más inteligente.
Wskaźnik
AI
ATR
+27
Supertrend Indicator
Wskaźnik
AI
RSI
+18
Session boxes with UTC offset, OR logic, adjustable opacity, and multi-day lookback.
Wskaźnik
Volume
Channel
+5
Spots volatility squeezes before they fire — the compression phase everyone else misses.
Wskaźnik
Parabolic SAR Alert - Trend reversal alerts with smart signals & custom alerts.
Wskaźnik
Pin Bar
Inside Bar
+2
Advanced candlestick pattern recognition with structural quality scoring, alerts and adaptive chart visuals.
Wskaźnik
ATR
Prop
+14
Optimize exits with Chandelier Exit! Visualize stop-loss points dynamically for improved trading precision and safety.

Cena

Od 12/06/2025
1
Sprzedaż
399
Bezpłatne instalacje