Penerangan
Penunjuk ini adalah alat analisis visual dan isyarat yang direka untuk mengautomasikan strategi perdagangan berdasarkan sesi atau pecahan jam tertentu.
📊 Keadaan Pasaran yang Dianalisis Penunjuk ini memisahkan Tindakan Harga bagi jam tertentu yang ditetapkan oleh pengguna. Ia secara automatik merekodkan titik tertinggi dan terendah bagi jam rujukan ini (disebut "Julat") dan menggunakannya sebagai tahap utama untuk sepanjang hari perdagangan. Pengiraan diset semula setiap hari pada tengah malam.
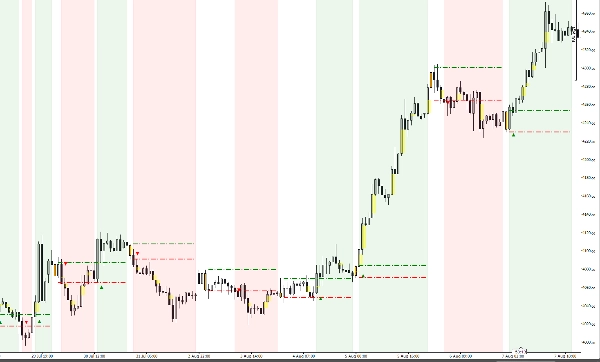
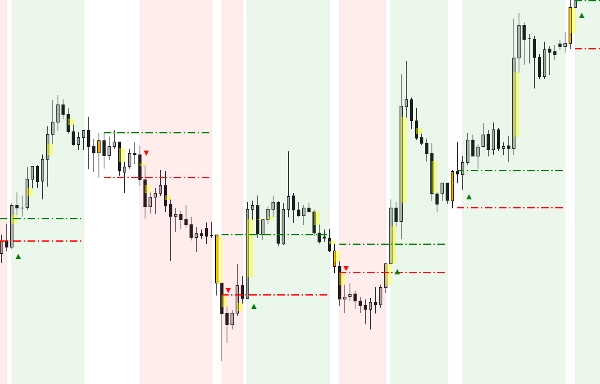
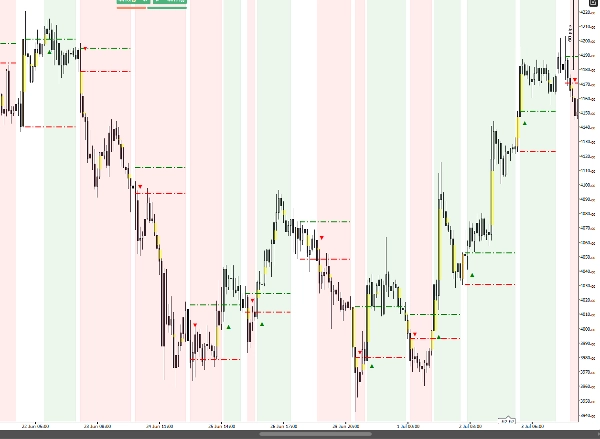
👁️ Tafsiran Isyarat & Elemen Visual Penunjuk ini direka untuk menjadi 100% visual:
- Lilin Sasaran Berwarna: Lilin jam rujukan diserlahkan (isi dan garis luar) untuk pengenalan segera.
- Garis Berbintik (Tinggi/Rendah): Ini memproyeksikan julat rujukan sepanjang hari perdagangan.
- Anak Panah Isyarat (▲/▼): Anak panah muncul sebaik sahaja lilin ditutup di luar julat (pecahan disahkan), memberikan titik masuk yang jelas.
- Zon Latar Berwarna: Latar carta diwarnakan hijau (bias kenaikan) atau merah (bias penurunan) untuk menunjukkan momentum semasa selepas pecahan.
⚙️ Parameter & Tetapan Utama
- Jam Sasaran (0-23): Memilih jam rujukan (biarkan pada tetapan lalai).
- Reka Bentuk 100% Boleh Disesuaikan: Pilih warna untuk garis pecahan (Tinggi/Rendah), lilin rujukan, dan garis luarnya.
- Ketelusan Latar: Laraskan ketelusan (0-255) zon trend untuk memastikan carta anda bersih dan mudah dibaca.
📈 Kes Penggunaan & Senario Tipikal Sesuai untuk Perdagangan Harian Emas (XAUUSD). Senario tipikal melibatkan pembingkaian volatiliti pra-pasaran (contohnya, sesi Asia atau pra-London) dan berdagang dengan dorongan momentum kuat yang berlaku apabila julat ini pecah pada pembukaan pasaran utama.
Ringkasan
The indicator provides clear visual cues: the reference hour candle is highlighted with distinct colors; arrows appear when a candle closes outside the established range, signaling a confirmed breakout; and the chart background shifts to green or red to indicate bullish or bearish momentum following the breakout. Users can customize the target hour, colors of breakout lines and reference candle, and the opacity of background trend zones.
Typical use involves capturing pre-market volatility, such as during the Asian or pre-London sessions, and trading the momentum that follows when the price breaks out of the defined range at major market opens. The indicator supports breakout and trend strength signals based on bar data and tick data inputs.