
HA
Indicador
2 compras
Versión 1.0, Jan 2026
Windows, Mac
4.0
Valoraciones: 1
Descripción
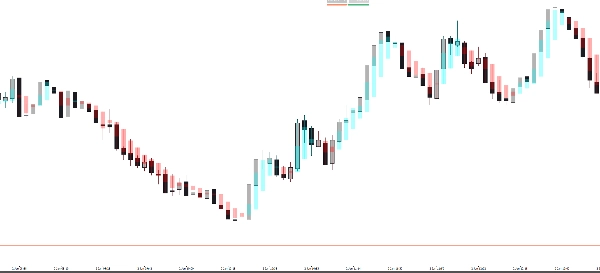
El Pro Heikin Ashi Visual Overlay es la herramienta perfecta para los traders que desean los beneficios de suavizado de tendencia de las velas Heikin Ashi mientras mantienen activos sus gráficos estándar de velas o barras.
Los gráficos tradicionales de Heikin Ashi requieren que cambies todo el tipo de gráfico, lo que dificulta ver la acción exacta del precio. Este indicador resuelve eso dibujando las velas Heikin Ashi como una superposición semitransparente, permitiéndote detectar reversiones de tendencia y el momentum del mercado al instante sin perder de vista el precio real.
¿Por qué usar esta Superposición?
- 💎 Reducción de Ruido: Heikin Ashi filtra el ruido del mercado, facilitando mantenerse en operaciones ganadoras.
- 🕯️ Vista de Gráfico Dual: Mantén tus velas estándar para la acción/patrones de precio mientras usas la superposición HA para la dirección de la tendencia.
- 🎨 Totalmente Personalizable: Ajusta la opacidad y los colores para que coincidan con tu espacio de trabajo (modo oscuro o claro).
- 🚀 Identificación Instantánea de Tendencias: Las zonas azul (alcista) y roja (bajista) te ayudan a evitar operar contra el momentum.
Características Clave:
- Transparencia Inteligente: Configura la opacidad para que la superposición no oculte tu acción principal del precio.
- Alineación Perfecta: Calculada en tiempo real para coincidir con los valores Heikin Ashi del marco temporal actual.
- Diseño Profesional: Visuales limpios que no saturan tu gráfico.
- Universal: Funciona en todos los marcos temporales (M1 a Mensual) y todos los activos (Forex, Acciones, Cripto, Índices).
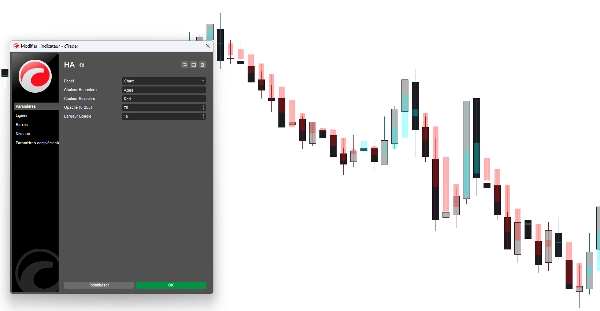
Cómo usarlo:
- Aplica el indicador a tu gráfico.
- Ajusta la Opacidad y el Ancho del Cuerpo en la configuración según tu preferencia.
- Usa las velas HA para confirmar la fuerza de la tendencia:
-
- Mechas largas en la dirección de la tendencia = Momentum fuerte.
- Cuerpos pequeños con mechas en ambos lados = Reversión potencial.
Parámetros:
- Color Alcista: Color personalizado para las velas HA alcistas.
- Color Bajista: Color personalizado para las velas HA bajistas.
- Opacidad (0-255): Controla qué tan "fantasmales" o sólidas aparecen las velas.
- Ancho de la Vela: Ajusta el grosor de las velas HA para que se adapten perfectamente a tu nivel de zoom.
Resumen
Resumen de IA
The Pro Heikin Ashi Visual Overlay is an indicator designed to enhance trend analysis by overlaying Heikin Ashi candles on standard candlestick or bar charts. Unlike traditional Heikin Ashi charts that replace the entire chart type, this tool provides a semi-transparent overlay, allowing traders to observe smoothed trend signals while retaining visibility of actual price action.
Key features include noise reduction to filter market fluctuations, customizable opacity and colors for integration with different chart backgrounds, and real-time alignment with the current timeframe’s Heikin Ashi calculations. The overlay uses blue and red zones to indicate bullish and bearish trends, aiding in immediate trend identification. It supports all timeframes from one minute to monthly and is compatible with various asset classes including Forex, stocks, cryptocurrencies, commodities, and indices.
Users can adjust candle width and opacity to suit their chart zoom level and visual preferences. The indicator facilitates dual-chart viewing, enabling simultaneous analysis of precise price patterns and smoothed trend momentum. It is designed with clean visuals to avoid chart clutter and supports professional trading environments.
Perfil del indicador
Valoraciones de clientes
4.0
Valoraciones: 1
5 | 0 % | |
4 | 100 % | |
3 | 0 % | |
2 | 0 % | |
1 | 0 % |
Conversación
Preguntas frecuentes
Forex
Signal
Indices
Commodities
Crypto
Stocks
Los productos disponibles a través de cTrader Store, incluidos bots, indicadores y plugins para operar, son proporcionados por desarrolladores de terceros y están disponibles únicamente con fines informativos y de acceso técnico. cTrader Store no es un bróker, por lo que no proporciona asesoramiento de inversión, recomendaciones personales ni ninguna garantía de rentabilidad futura.
Más de este autor


Precio
Desde 27/10/2025
10
Ventas