
Moving Average Plus
Индикатор
144 скачивания
Версия 1.0, Aug 2025
Windows, Mac
С 26/05/2025
449.3M
Торгуемый объем
61.1K
Выигранные пипы
15
Продажи
1.43K
Бесплатные установки
Описание
Глобально
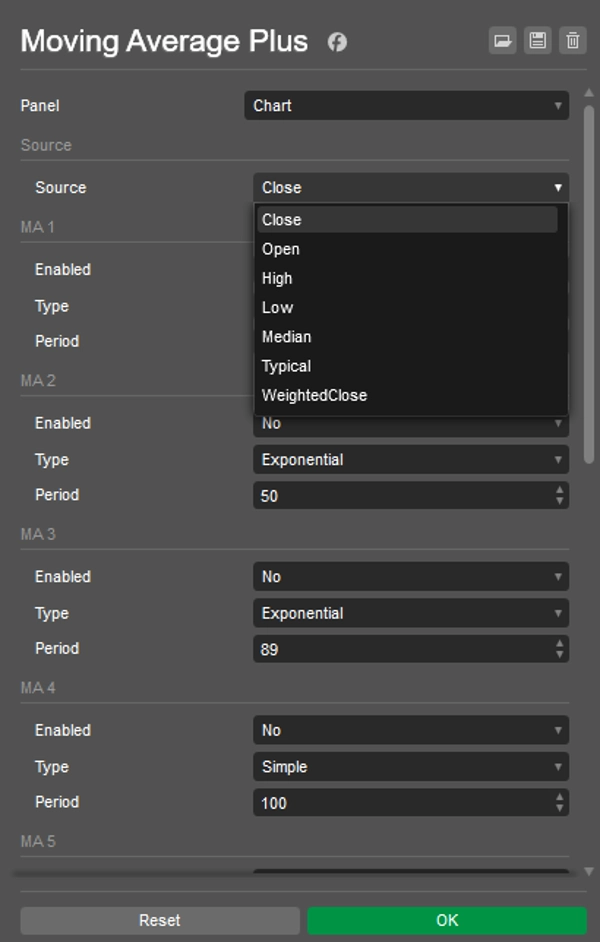
- Источник – входная цена, используемая для всех линий: Закрытие, Открытие, Максимум, Минимум, Медиана, Типичная или Взвешенное закрытие.
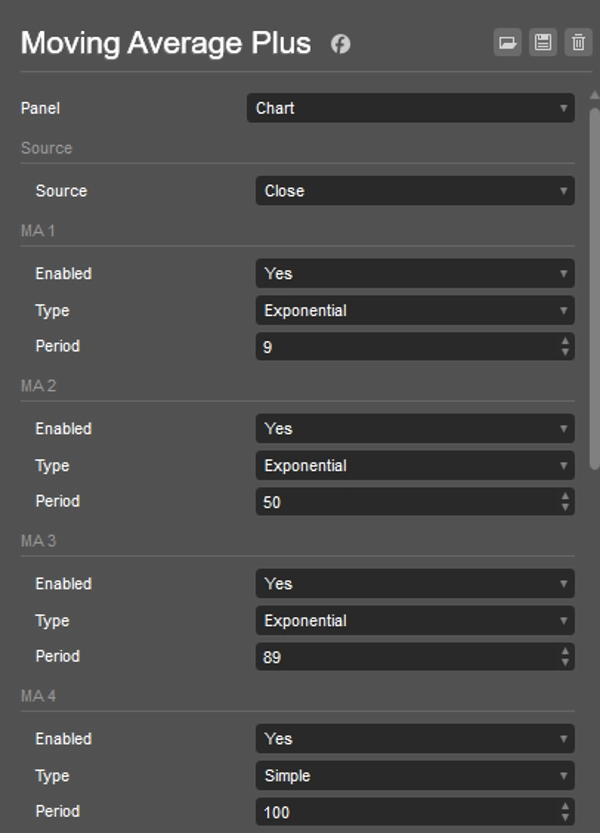
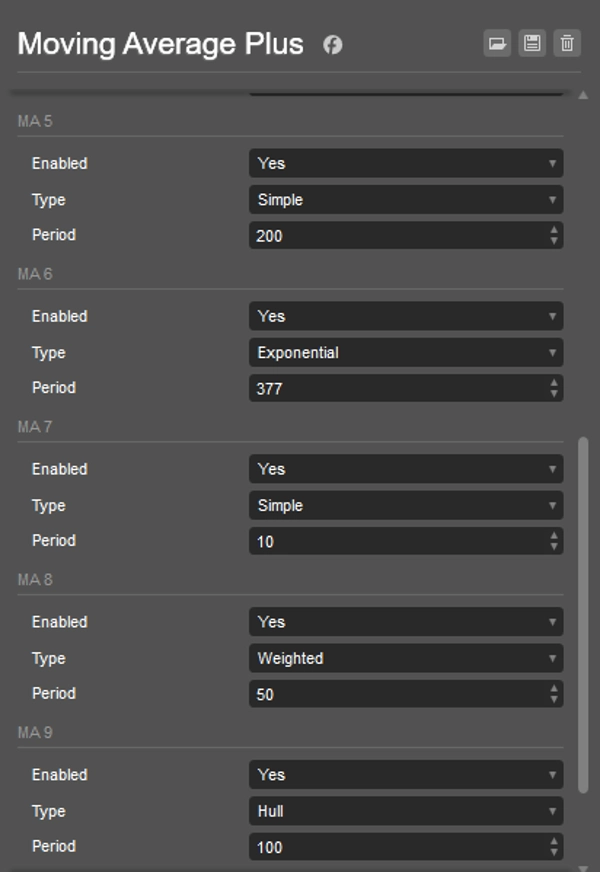
Для каждой линии (MA 1 … MA 10)
- Включено – включить/выключить линию (отключённые линии не вычисляются).
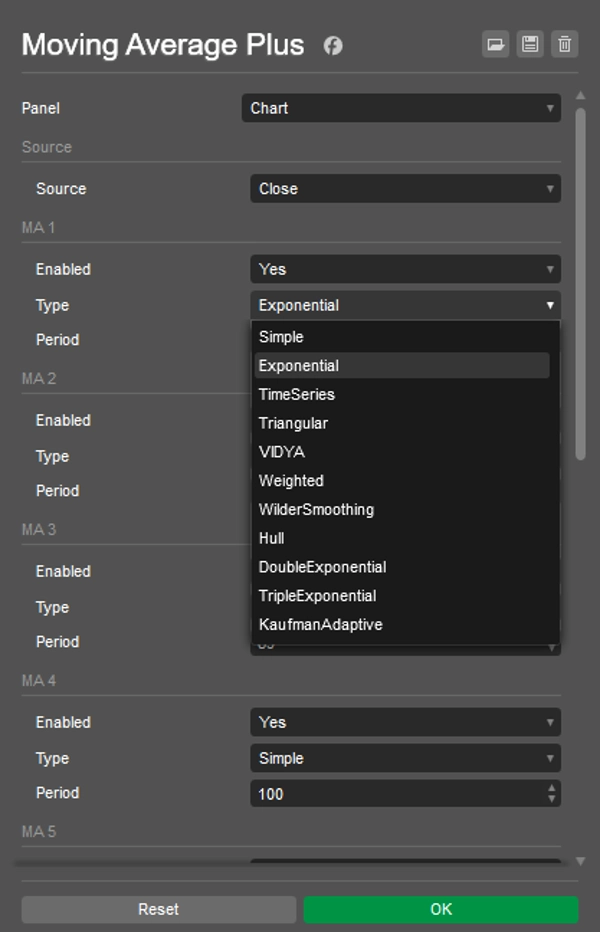
- Тип – выберите любой из
MovingAverageTypecTrader (например, Простое, Экспоненциальное, Взвешенное, Сглаживание Уайлдера, Халл, Треугольное, Временной ряд и т.д.).
Примечание: некоторые типы зависят от вашей версии cTrader; если тип недоступен (например, Халл), выберите другой. - Период – длина MA (≥1).
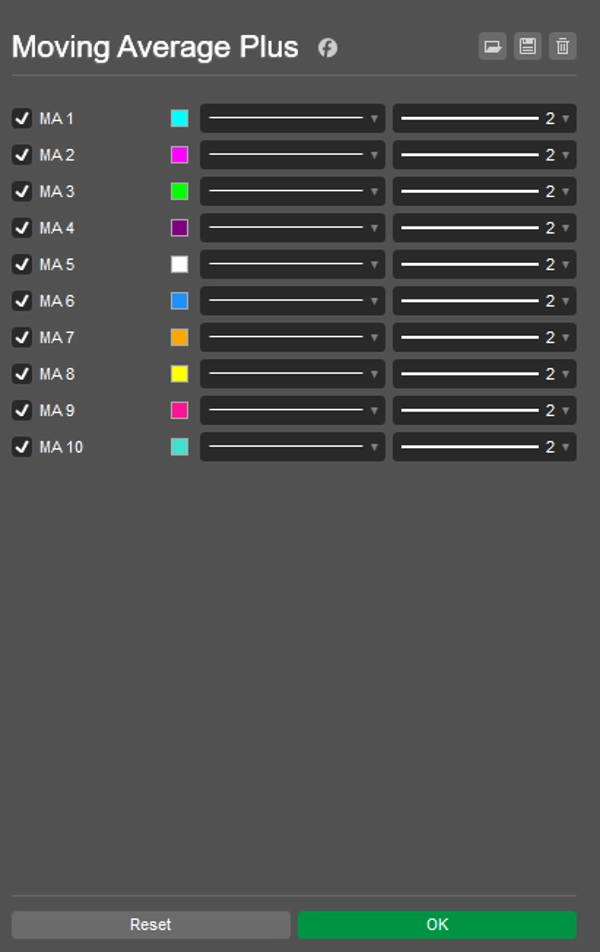
Цвета и толщина
- Настраивается на вкладке Цвета параметров индикатора для каждого вывода (“MA 1” … “MA 10”).
Советы
- Для повышения производительности отключайте неиспользуемые линии.
- Если вы измените Источник или Тип/Период, индикатор пересчитается автоматически.
- Wilder в cTrader называется Сглаживание Уайлдера (
MovingAverageType.WilderSmoothing).
Сводка
ИИ-сводка
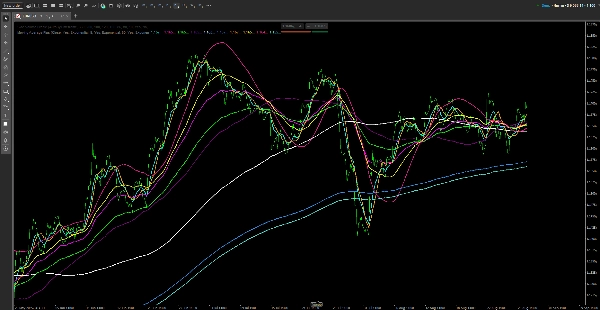
Moving Average Plus is a technical indicator for trading platforms that provides up to 10 configurable moving average lines. Each line can be individually enabled or disabled to optimize performance. Users select a single price source—such as Close, Open, High, Low, Median, Typical, or Weighted Close—that applies to all moving averages. For each line, the type of moving average can be chosen from various options including Simple, Exponential, Weighted, Wilder Smoothing, Hull, Triangular, and Time Series, depending on platform support. The period (length) of each moving average is adjustable with a minimum of 1. Colors and line thickness for each moving average are customizable through the indicator’s color settings. The indicator automatically recalculates when changes are made to the price source, type, or period. This tool is designed to assist traders in analyzing price trends by overlaying multiple moving averages with flexible configurations on their charts.
Профиль индикатора
Отзывы покупателей
0.0
Отзывы: 0
Отзывы покупателей
У этого продукта еще нет отзывов. Уже попробовали его? Поделитесь впечатлениями!
Обсуждение
Частые вопросы
Продукты, доступные в cTrader Store, включая торговых ботов, индикаторы и плагины, предоставляются сторонними разработчиками и доступны исключительно в информационных и технических целях. cTrader Store не является брокером и не предоставляет инвестиционные консультации, персональные рекомендации или какие-либо гарантии будущей доходности.


Цена
С 26/05/2025
449.3M
Торгуемый объем
61.1K
Выигранные пипы
15
Продажи
1.43K
Бесплатные установки