
Trend Cycle
Индикатор
181 скачивания
Версия 1.0, Nov 2025
Windows, Mac
Описание
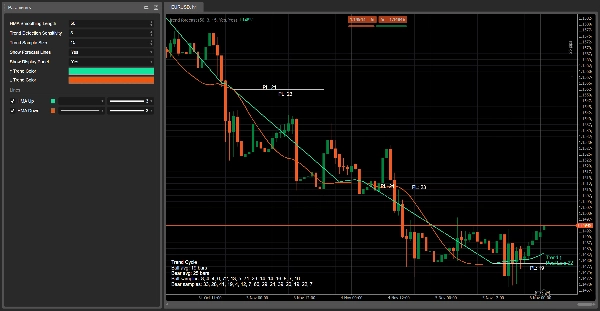
Trend Cycle — это инструмент анализа трендов, который фокусируется на продолжительности тренда, а не только на направлении.
Он:
- Обнаруживает бычьи и медвежьи тренды на основе наклона скользящей средней Халла (HMA).
- Подсчитывает, сколько баров текущий тренд активен (Реальная длина).
- Отдельно сохраняет длины недавних восходящих и нисходящих трендов.
- Вычисляет среднюю длину бычьих и медвежьих трендов (Среднее быков / Среднее медведей).
- Рисует:
-
- Зеленую HMA во время бычьих трендов и красную HMA во время медвежьих трендов.
- Горизонтальные проекционные линии в начале каждого тренда с меткой типа
PL: 18(Вероятная длина в барах). - Живую метку рядом с текущей ценой, показывающую направление тренда и Реальную длину.
- Панель отображения с:
-
- средней продолжительностью бычьих и медвежьих трендов,
- списками недавних длин трендов (до выбранного размера выборки).
Цель — помочь вам ответить на вопрос:
«Сколько этому тренду лет и как долго обычно длятся подобные тренды?»
Как это работает (логика)
- Скользящая средняя Халла (HMA)
Индикатор вычисляет скользящую среднюю Халла по цене закрытия с использованием параметра Длина сглаживания HMA.
HMA более гладкая, чем простая или экспоненциальная скользящая средняя, но быстро реагирует на изменения направления. - Определение тренда по наклону
За последние Чувствительность определения тренда баров проверяется HMA:
Пока тренд определён, счётчик (Реальная длина) увеличивается с каждым баром, отражая продолжительность текущего тренда. -
- Если HMA строго растёт → тренд бычий (↑).
- Если HMA строго падает → тренд медвежий (↓).
- В противном случае сохраняется предыдущее состояние тренда.
- Запись длин трендов
Когда тренд меняется с бычьего на медвежий или наоборот: -
- Сохраняется продолжительность завершённого тренда:
-
- бычьи тренды в список бычьих,
- медвежьи тренды в список медвежьих.
- Каждый список ограничен параметром Размер выборки трендов (например, последние 10 трендов).
- Эти выборки используются для вычисления:
-
- Среднее быков = средняя длина бычьего тренда.
- Среднее медведей = средняя длина медвежьего тренда.
- Проекции вероятной длины
В начале каждого нового тренда, если есть достаточно выборок:
Эти проекции сохраняются на графике как история, чтобы вы могли визуально сравнить прогнозируемую и фактическую продолжительность трендов. -
- Вычисляет среднюю длину для данного типа тренда (бычьего или медвежьего).
- Рисует горизонтальную линию от бара начала тренда примерно на столько баров.
- Размещает метку в центре линии:
-
PL: X→ Вероятная длина = X баров.
- Живая метка
На каждом баре индикатор рисует одну живую метку рядом с HMA:
Она показывает текущее направление тренда и точно сколько баров он длится на данный момент. -
- Пример текста:
-
Trend ↑
Real Len: 7
- Цвет:
-
- Зеленый (↑) для бычьих трендов
- Оранжевый/красный (↓) для медвежьих трендов
- Панель отображения (внизу слева)
Когда включена опция Показать панель отображения, в углу графика появляется статическая текстовая панель с информацией:
Она служит быстрым статистическим обзором недавнего поведения трендов на данном символе/таймфрейме. -
- Заголовок: Trend Cycle
Bull avg: X barsBear avg: Y barsBull samples:список недавних длин бычьих трендовBear samples:список недавних длин медвежьих трендов
Как читать это на практике
- Зеленая HMA + «Trend ↑»
→ Активен бычий тренд.
→Real Lenпоказывает, сколько баров он длится на данный момент.
→ Последняя линияPL: Xдаёт визуальное представление о том, как долго обычно длятся подобные бычьи тренды. - Красная HMA + «Trend ↓»
→ Активен медвежий тренд.
→Real Len= возраст текущего нисходящего тренда.
→ Сравните Real Len сBear avgна панели, чтобы понять, молодой это ход или зрелый. - Когда Real Len приближается к среднему или превышает его (Среднее быков / Среднее медведей):
→ Текущий тренд статистически считается «старым» по сравнению с недавней историей.
→ Вы можете выбрать: -
- затянуть стопы,
- фиксировать прибыль,
- быть осторожнее с новыми входами в этом направлении.
- Короткие тренды против длинных трендов
-
- Много очень коротких трендов → флет / среднее возвращение.
- Мало длинных трендов → более направленный рынок с продолжительными движениями.
Сводка
ИИ-сводка
Trend Cycle is a technical indicator designed to analyze trend duration in financial markets. It detects bullish and bearish trends by evaluating the slope of a Hull Moving Average (HMA) applied to closing prices, providing a smoother yet responsive measure of trend direction. The indicator counts the number of bars the current trend has been active (Real Length) and records the lengths of recent up-trends and down-trends separately. Using these samples, it calculates average durations for bullish and bearish trends.
Visual elements include a green HMA line during bullish trends and a red HMA line during bearish trends. Horizontal projection lines mark the probable length of each trend at its start, labeled with "PL: X" to indicate expected duration in bars. A live label near the current price displays the active trend direction and its age in bars. An optional display panel offers a summary of average trend durations and recent trend length samples.
Trend Cycle helps users assess how long the current trend has lasted relative to historical trends, aiding decisions such as adjusting stops or managing entries. It supports analysis across various markets including Forex, cryptocurrencies, indices, commodities, and stocks.
Профиль индикатора
Отзывы покупателей
0.0
Отзывы: 0
Отзывы покупателей
У этого продукта еще нет отзывов. Уже попробовали его? Поделитесь впечатлениями!
Обсуждение
Частые вопросы
BTCUSD
Forex
Signal
Breakout
Indices
EURUSD
Commodities
GBPUSD
NZDUSD
Martingale
Bollinger
Prop
ZigZag
Scalping
Supertrend
Crypto
Grid
Stocks
AI
XAUUSD
NAS100
USDJPY
Продукты, доступные в cTrader Store, включая торговых ботов, индикаторы и плагины, предоставляются сторонними разработчиками и доступны исключительно в информационных и технических целях. cTrader Store не является брокером и не предоставляет инвестиционные консультации, персональные рекомендации или какие-либо гарантии будущей доходности.


![Логотип продукта "Tabajara corrigido[fix]"](https://cdn.ctrader.com/image/webp/7f4bbef8-b245-4ebd-80d7-582fffc0c90c_28378)

Цена
42.11M
Торгуемый объем
6.13M
Выигранные пипы
230
Продажи
8.52K
Бесплатные установки