"Cutrim Theory" logo
Indicator
98 downloads
Version 1.0, Apr 2026
Windows, Mac
"Cutrim Theory" uploaded image
Since 31/03/2025
176.9M
Traded volume
470.18K
Pips won
98
Free installs

TeoriaCutrim is a statistical overlay indicator designed to quantify recent market behavior through candle distribution and volatility analysis. Instead of predicting direction, it provides objective data about what the market has just done within a configurable window of candles.

Market Data Analyzed
The indicator evaluates a user-defined number of recent candles (Lookback period) and extracts:

  • Number and percentage of bullish candles (close > open)
  • Number and percentage of bearish candles (close < open)
  • Difference between bullish and bearish dominance
  • Average candle range (in pips)
  • Current candle range (in pips)
  • Total price range across the analyzed window

Visual Output and Interpretation
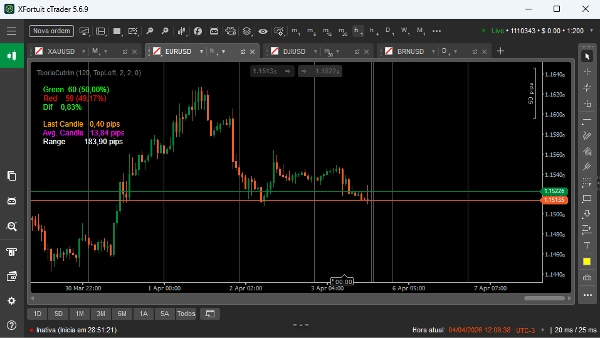
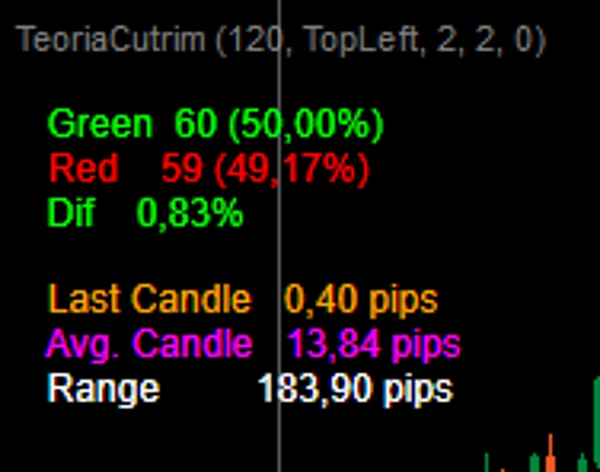
The indicator displays key metrics directly on the chart:

  • Green: total bullish candles and percentage
  • Red: total bearish candles and percentage
  • Dif: absolute difference between bullish and bearish percentages
  • Last Candle: current candle size in pips
  • Avg. Candle: average size of candles in the selected window
  • Range: distance between highest high and lowest low in the window

Interpretation is straightforward:

  • A higher number of bullish candles suggests recent upward pressure
  • A higher number of bearish candles suggests recent downward pressure
  • A low difference (Dif) indicates balance or randomness
  • Increasing average candle size indicates expanding volatility
  • Large total range suggests market expansion, while small range suggests compression

Key Parameters

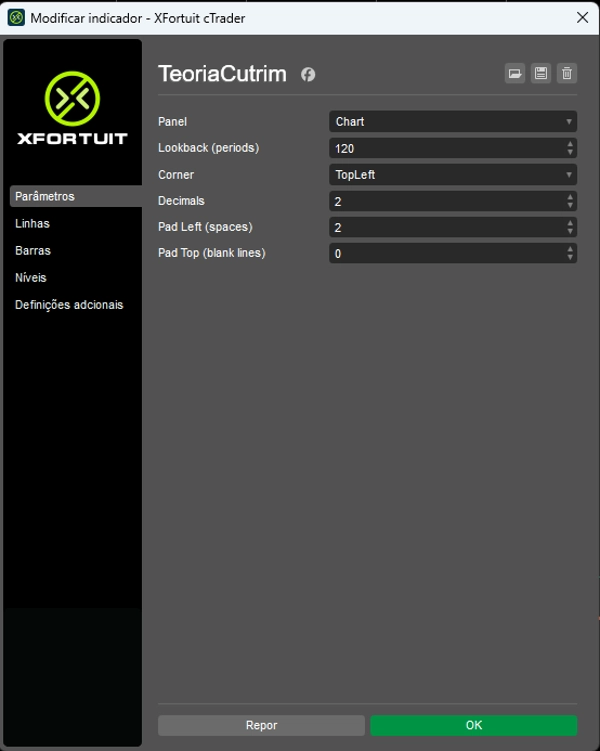
  • Lookback: number of candles used for analysis (fully adjustable)
  • Corner: screen position of the data display
  • Decimals: number of decimal places shown
  • Pad Left / Pad Top: visual spacing adjustments

Use Cases
TeoriaCutrim is best used as a context tool, not a signal generator. Typical applications include:

  • Measuring statistical imbalance before entering trades
  • Identifying volatility expansion or contraction
  • Filtering trades based on recent candle behavior
  • Supporting quantitative or probability-based strategies

Target User
This indicator is designed for traders who rely on data, statistics, and objective analysis rather than subjective pattern recognition. Suitable for both discretionary and systematic traders.

Indicator profile
0.0
Reviews: 0
Customer reviews
No reviews for this product yet. Already tried it? Be the first to tell others!
Forex
EURUSD
Products available through cTrader Store, including trading bots, indicators and plugins, are provided by third-party developers and made available for informational and technical access purposes only. cTrader Store is not a broker and does not provide investment advice, personal recommendations or any guarantee of future performance.

You may also like

Indicator
AI
Forex
+7
Signal Strike is a professional trading indicator delivers clear, high‑confidence entry signals directly on your chart
Indicator
BOS
MSS
+3
Advanced indicator to highlight key execution context and help aligning structure, location, and risk.
Indicator
ATR
Forex
+6
The Smart Money Concepts indicator is an all-in-one overlay tool that automatically detects OB, FVG ecc..
Indicator
ATR
Signal
+2
Visual Trend Momentum is a MA/ATR/Volume trend tool. Visual signals for strong trends & reversals. Customizable. 📈📉
Indicator
Prop
Forex
+11
Market Structure Shift – Professional Market Structure Oscillator
Indicator
ATR
Channel
+5
This fifth indicator is highly visual and focused on Supply and Demand zones
Indicator
Prop
Forex
NEW - PNLs as % - daily, weekly, monthly, or yearly & Spread, Time To Close, PNL Alerts, custom Bid / Ask lines
Indicator
Prop
Forex
+9
Automatically plots fractal high and low lines on your chart so you always have clean, reliable structure levels.
Indicator
ATR
Forex
+4
Super trend with support and resistance levels
Indicator
JMA-like is a highly responsive and ultra-smooth moving average designed to replicate the behavior of the original JMA!
Indicator
Support & Resistance
Multi-Timeframe exhaustion indicator. Detects trend loss with Doji filter & dynamic volatility.
Indicator
Color-Based Market Pressure & Volatility Visualizer The Kandika Heatmap Indicator
Indicator
Indices
Breakout
+1
You can use the cTrader Pivot Points Pro indicator to find a good pullback entry in a trend
Indicator
ATR
VWAP
+2
Volume-Weighted Trend System that combines VWMA with ATR for volatility filtering.
Indicator
AI
SMC
+15
Multi-Timeframe Swing Points Indicator for cTrader that identifies swing highs and lows on both the current timeframe.
Indicator
ATR
RSI
+13
is a trend-following indicator designed to provide a clear view of market direction, momentum, and strength
Indicator
AI
SMC
+19
ZigZag Pro — Advanced swing detection with ATR threshold, fractal confirmation, and colored segments. Clean market
Indicator
Channel
Moving Average
+2
This is a high-quality implementation of the Squeeze Momentum Candle logic applied directly to candle coloring.
Since 31/03/2025
176.9M
Traded volume
470.18K
Pips won
98
Free installs