
VSA
지표
262 다운로드
버전 1.0, Nov 2025
Windows, Mac
5.0
리뷰: 1
설명
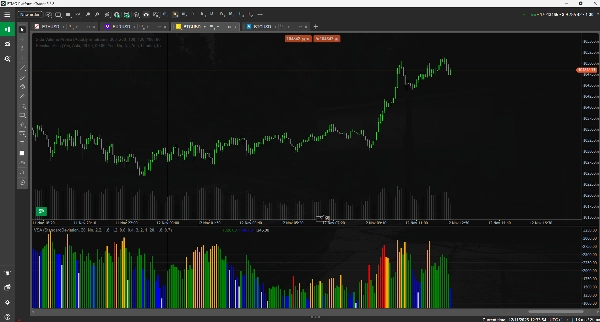
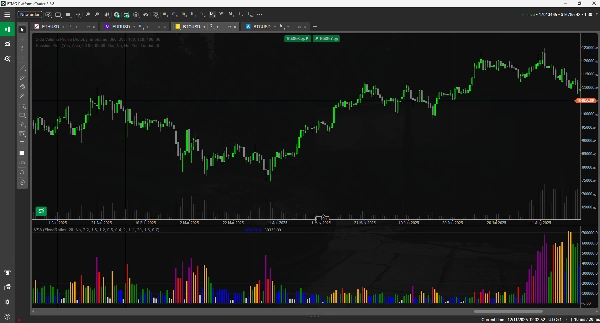
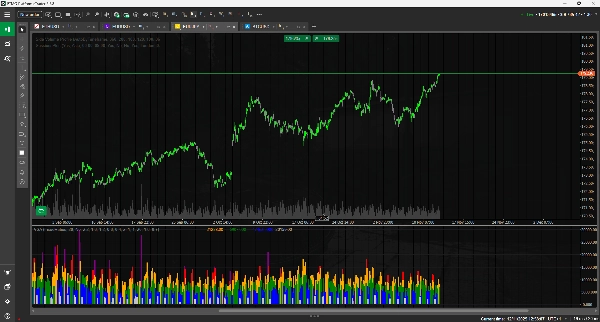
세 가지 뚜렷한 분석 모드를 갖춘 고급 다중 모드 거래량 지표입니다. 거래 스타일에 맞게 즉시 모드를 전환할 수 있습니다.
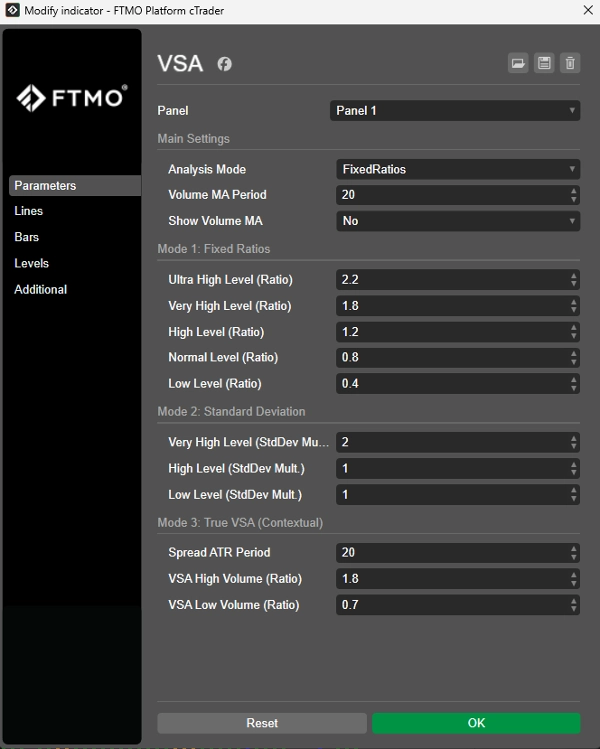
모드 1: 고정 비율
거래량을 이동 평균에 사용자 정의 고정 비율(예: "높음"의 경우 2.0배)을 곱한 값과 비교하여 분류합니다.
적합 대상: 수동 제어와 고정 임계값을 선호하는 트레이더.
모드 2: 표준 편차 (적응형)
이 모드는 시장 변동성에 자동으로 적응합니다. 거래량을 평균(이동 평균)에서 얼마나 많은 표준 편차만큼 떨어져 있는지에 따라 분류합니다.
적합 대상: 어떤 종목이나 시간 프레임에서도 "즉시 사용 가능한" 적응형 도구.
모드 3: 진정한 VSA (맥락적)
고전적이고 전문적인 접근법입니다. 이 모드는 거래량 + 스프레드(범위) + 종가 위치를 결합하여 바의 맥락을 분석하고 주요 신호를 식별합니다.
요약
AI 요약
The VSA indicator is an advanced volume analysis tool offering three distinct modes to suit different trading approaches.
1. Fixed Ratios mode categorizes volume by comparing it to a moving average multiplied by user-defined fixed ratios, providing manual control over volume thresholds.
2. Standard Deviation mode adapts automatically to market volatility by classifying volume based on its deviation from the moving average, suitable for use across various instruments and timeframes without manual adjustment.
3. True VSA (Contextual) mode applies a professional volume spread analysis by evaluating volume in conjunction with bar range and close position to identify key market signals.
This multi-mode indicator supports a wide range of markets including Forex, cryptocurrencies (e.g., BTCUSD, ETH), commodities (e.g., gold, oil), indices (e.g., NAS100, SP500), and stocks. It enables traders to switch instantly between modes to align with their preferred analysis style and trading strategy.
지표 프로필
고객 리뷰
5.0
리뷰: 1
5 | 100 % | |
4 | 0 % | |
3 | 0 % | |
2 | 0 % | |
1 | 0 % |
상담
자주 묻는 질문(FAQ)
BTCUSD
Forex
Signal
Indices
EURUSD
Commodities
GBPUSD
NZDUSD
Prop
Crypto
Stocks
XAUUSD
NAS100
ATR
USDJPY
트레이딩 봇, 지표, 플러그인 등 cTrader Store에서 제공되는 상품은 제3자 개발자에 의해 제공되며, 이는 단순히 정보 및 기술적 접근을 목적으로 제공된 것입니다. cTrader Store는 중개인이 아니며, 투자 조언, 개인별 추천 또는 향후 성과에 대한 어떠한 보장도 제공하지 않습니다.
이 작성자의 상품 더 보기


좋아하실 만한 다른 항목


!["[Stellar Strategies] MARSI Signal Plotter" 로고](https://cdn.ctrader.com/image/webp/7b2b8da6-8f8e-4646-8d4a-4710c516c01e_25567)


!["[Hamster-Coder] Moving Average MTF" 로고](https://cdn.ctrader.com/image/webp/b11b98b1-194d-4b8e-b00e-d611826ad159_31226)

가격
가입일 26/05/2025
381M
거래량
60.65K
핍 수익
14
판매
1.38K
무료 설치