
ICT First Presented FVG
อินดิเคเตอร์
188 ดาวน์โหลด
เวอร์ชัน 1.1, Apr 2026
Windows, Mac

คำอธิบาย
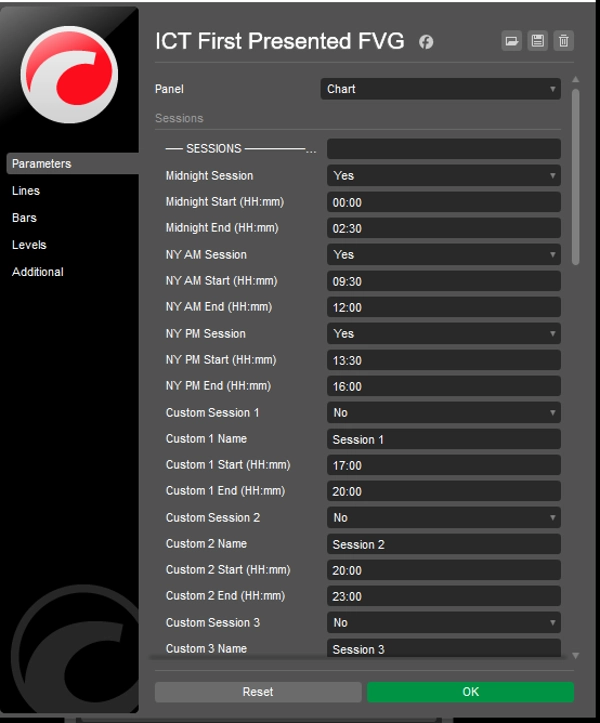
นี่คือตัวชี้วัดเฉพาะทางที่ใช้ ICT ซึ่งเน้นที่จุด "สมอ" เดียว: การเปิดตลาดหุ้นนิวยอร์กเวลา 9:30 น..
นี่คือการสรุปตรงประเด็น:
🎯 ฟังก์ชันหลัก
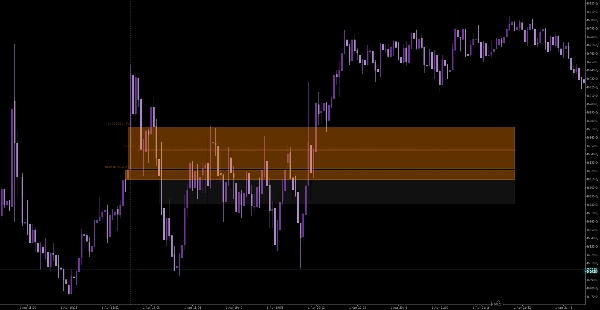
ตัวชี้วัดจะไม่สนใจการเคลื่อนไหวของราคาใดๆ จนกว่าจะถึงเวลาเปิดตลาด 9:30 น. เมื่อเปิดตลาดแล้ว มันจะค้นหา ช่องว่างมูลค่ายุติธรรม (FVG) แรกสุด ที่ปรากฏ ในทฤษฎี ICT ช่องว่างแรกนี้มักเป็น "รอยเท้าของสถาบัน" สำหรับทิศทางของช่วงเช้า
🛠️ คุณสมบัติหลัก
- การค้นหาอัตโนมัติ: คุณไม่ต้องสแกนกราฟ 1 นาทีหรือ 5 นาทีด้วยตัวเอง; มันจะเน้นช่องว่างที่ไม่สมดุลที่ถูกต้องแรกทันทีหลังเสียงระฆัง
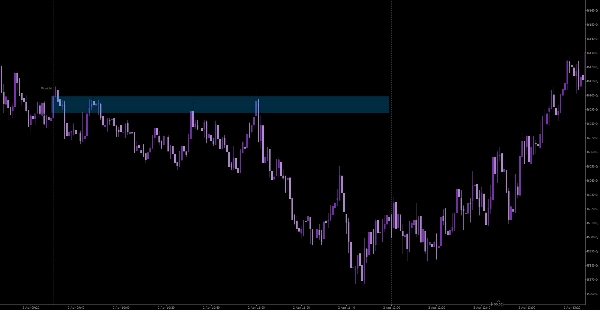
- กล่องขยาย: มันวาดกล่องที่ฉายไปข้างหน้าถึงราคาปัจจุบัน เพื่อให้คุณเห็นว่าราคาจะ "ทดสอบซ้ำ" หรือ "เติมเต็ม" ช่องว่างเช้านั้นในภายหลังหรือไม่
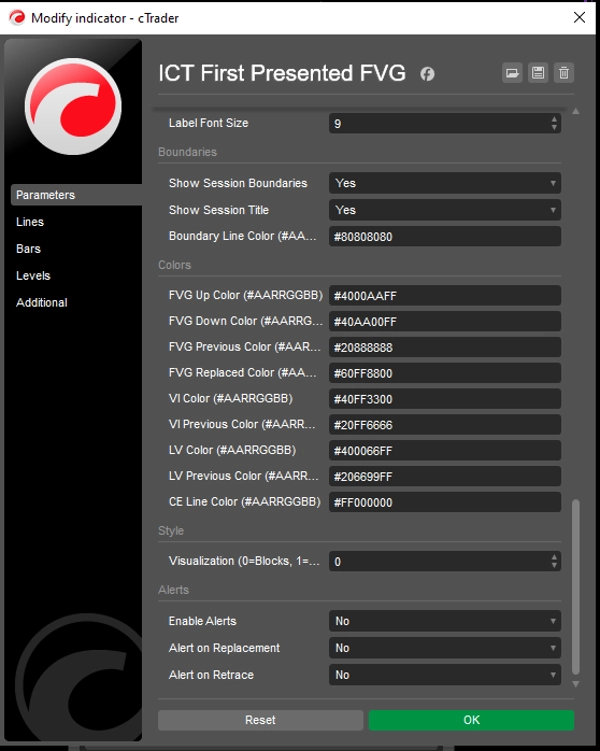
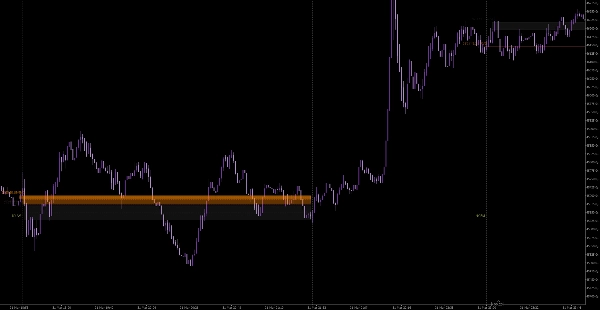
- การควบคุมด้วยภาพ: คุณสามารถสลับระหว่างบล็อกทึบหรือเส้นเรียบง่ายและเปลี่ยนสีให้เหมาะกับเทมเพลตกราฟของคุณ
- การติดตามรูปแบบ: เพิ่มป้ายวันที่เพื่อให้คุณย้อนดูวันที่ก่อนหน้าได้ว่าช่องว่าง FVG เวลา 9:30 น. นั้นทำหน้าที่เป็นแนวรับหรือแนวต้านบ่อยแค่ไหน
💡 วิธีที่คุณจะทำได้ดียิ่งขึ้น
แม้ว่าเครื่องมือนี้จะดีสำหรับการหาจุด "ตั้งค่า" แต่มันไม่ได้ให้ "บริบท" เพื่อเพิ่มอัตราชนะของคุณด้วยสิ่งนี้:
- อคติกรอบเวลาที่สูงกว่า: ให้ทำการซื้อ "Long" FVG ที่เวลาเปิด 9:30 น. เฉพาะเมื่อแนวโน้ม 1 ชั่วโมงหรือ 4 ชั่วโมงของคุณเป็นขาขึ้นอยู่แล้ว หากคุณทำทุก "FVG แรก" โดยไม่พิจารณา คุณจะถูกตัดขาดทุนบ่อยครั้ง
- รอ "Judas Swing": บ่อยครั้ง FVG แรกที่ 9:30 น. เป็นกับดัก (การเคลื่อนไหวหลอก) หาก FVG แรกล้มเหลวและราคาสร้าง ช่องว่างที่สอง ในทิศทางตรงกันข้าม นั่นมักจะเป็นการเคลื่อนไหวจริงของวัน
- กฎ "เติมเต็ม": หากราคากลับมาและปิดช่องว่าง FVG เวลา 9:30 น. อย่างสมบูรณ์ แสดงว่า "ความแข็งแกร่ง" ของสถาบันได้หายไปแล้ว ให้มองหาการเทรดที่ราคาสัมผัสขอบกล่องและตอบสนองออกไปจากมันเท่านั้น
สรุป
สรุปโดย AI
ICT First Presented FVG is a specialized trading indicator based on Inner Circle Trader (ICT) theory, designed to identify the first Fair Value Gap (FVG) that forms immediately after the 9:30 AM New York Stock Exchange open. This initial gap is considered a key institutional footprint indicating the morning session’s directional bias.
Key features include automated detection of the first valid imbalance after the market opens, eliminating the need for manual scanning of short-term charts. The indicator visually highlights this gap with an extended box projecting forward to the current price, allowing traders to monitor if and when the gap is retested or filled during the day. Users can customize the visual style with solid blocks or lines and adjust colors to match their chart templates. Additionally, date labels track past occurrences to analyze how often the 9:30 AM FVG acts as support or resistance.
The indicator supports markets including Forex, indices, commodities, stocks, and cryptocurrencies such as BTCUSD and EURUSD. It is intended to be used alongside higher timeframe trend analysis and price action context to improve trade decision-making, particularly by observing patterns like the "Judas Swing" and the behavior of price around the FVG fill level.
โปรไฟล์อินดิเคเตอร์
รีวิวจากลูกค้า
0.0
รีวิว: 0
รีวิวจากลูกค้า
ยังไม่มีรีวิวสำหรับผลิตภัณฑ์นี้ หากเคยลองแล้ว ขอเชิญมาเป็นคนแรกที่บอกคนอื่น!
การสนทนา
คำถามที่พบบ่อย
BTCUSD
Forex
Signal
Breakout
Indices
EURUSD
Commodities
GBPUSD
NZDUSD
Martingale
Prop
Scalping
SMC
Crypto
Grid
Stocks
AI
XAUUSD
NAS100
USDJPY
ผลิตภัณฑ์ที่มีให้บริการผ่าน cTrader Store รวมถึงบอทการเทรด อินดิเคเตอร์ และปลั๊กอิน มีให้บริการโดยนักพัฒนาบุคคลที่สามและมีไว้เพื่อวัตถุประสงค์ในการเข้าถึงข้อมูลและทางเทคนิคเท่านั้น cTrader Store ไม่ใช่โบรกเกอร์และไม่ได้ให้คำแนะนำการลงทุน คำแนะนำส่วนบุคคล หรือการรับประกันผลการดำเนินงานในอนาคต
เพิ่มเติมจากผู้เขียนคนนี้


ราคา
2.85K
ติดตั้งฟรี