
คำอธิบาย
https://chartshots.spotware.com/c/695be69b1a3ca
https://chartshots.spotware.com/c/695be2a98e848
https://chartshots.spotware.com/c/695be7e8e88fa
https://chartshots.spotware.com/c/695be31346fe7
https://chartshots.spotware.com/c/695be3bd18aea
https://chartshots.spotware.com/c/695be5d5687c7
รูปแบบแผนภูมิอัตโนมัติ
📊 มันคืออะไร?
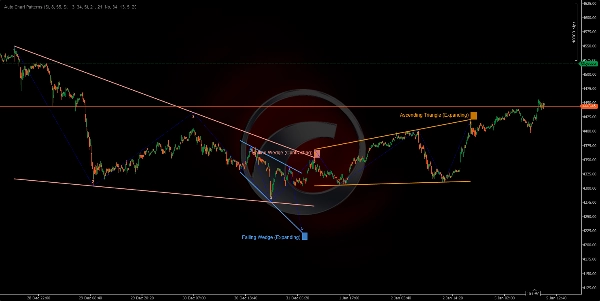
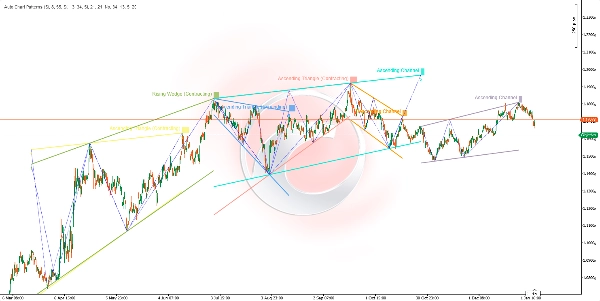
ตัวชี้วัด รูปแบบแผนภูมิอัตโนมัติ เป็นเครื่องมือสแกนรูปทรงเรขาคณิตขั้นสูงที่ตรวจจับและแสดงรูปแบบแผนภูมิคลาสสิกโดยอัตโนมัติด้วยการวิเคราะห์จุดสวิงหลายกรอบเวลา มันระบุ 14 รูปแบบเรขาคณิตที่แตกต่างกัน รวมถึงช่องทาง, เวดจ์ และสามเหลี่ยมโดยเชื่อมต่อจุดสูงสุดและต่ำสุดของสวิงด้วยเส้นแนวโน้ม สร้างระบบจดจำรูปแบบที่ครอบคลุม
🎯 ใช้ทำอะไร?
ตัวชี้วัดนี้ช่วยเทรดเดอร์ในการ:
- ตรวจจับโดยอัตโนมัติ 14 รูปแบบแผนภูมิคลาสสิก (ช่องทาง, เวดจ์, สามเหลี่ยม) 📐
- ระบุ โซนเบรกเอาท์ที่เป็นไปได้ ก่อนที่จะเกิดขึ้น ⚡
- แสดงภาพ โครงสร้างตลาด ผ่านความสัมพันธ์ราคาทางเรขาคณิต 🔍
- เทรด รูปแบบต่อเนื่องและกลับตัว พร้อมการยืนยันด้วยภาพ ✅
- กรองรูปแบบตาม ทิศทางแนวโน้มและประเภทจุดหมุนสุดท้าย 🎛️
- วิเคราะห์ หลายกรอบเวลาของสวิงพร้อมกัน เพื่อความสอดคล้อง 🌊
🔍 มันทำงานอย่างไร?
ระบบตรวจจับจุดสวิง 📍
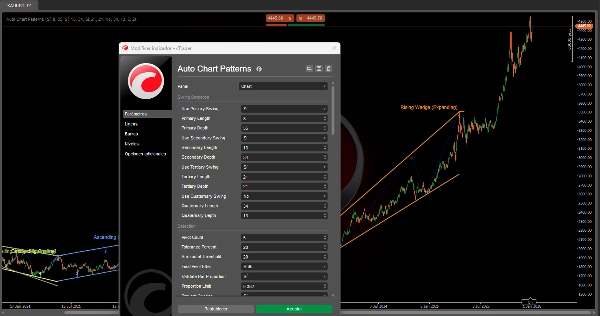
ตัวชี้วัดใช้ตัวตรวจจับสวิงอิสระสูงสุด สี่ตัว ทำงานพร้อมกัน แต่ละตัวมีความไวที่ปรับได้:
- ตรรกะการตรวจจับ:
-
- ตรวจสอบราคาสูงสุดและต่ำสุดในหน้าต่างหมุนเวียน (ช่วงเวลา)
- ระบุจุดสูงสุดท้องถิ่น (สวิงสูง) และจุดต่ำสุด (สวิงต่ำ)
- ยืนยันสวิงหลังจากผ่านเกณฑ์ความลึกขั้นต่ำ (ป้องกันเสียงรบกวน)
- สวิงสูง: ราคาทำจุดสูงสุดในช่วงเวลา จากนั้นลดลงเป็นเวลา
MinDepthแท่ง - สวิงต่ำ: ราคาทำจุดต่ำสุดในช่วงเวลา จากนั้นเพิ่มขึ้นเป็นเวลา
MinDepthแท่ง
- สี่ชั้นของสวิง:
-
- สวิงหลัก (ค่าเริ่มต้น: ความยาว 8, ความลึก 55) - โครงสร้างระยะยาว 🔵
- สวิงรอง (ค่าเริ่มต้น: ความยาว 13, ความลึก 34) - โครงสร้างระยะกลาง 🟢
- สวิงตติยภูมิ (ค่าเริ่มต้น: ความยาว 21, ความลึก 21) - โครงสร้างระยะสั้น 🟡
- สวิงจตุรภูมิ (ค่าเริ่มต้น: ปิดใช้งาน) - กรอบเวลาที่กำหนดเอง 🟣
ตัวตรวจจับแต่ละตัวสามารถเปิด/ปิดได้อย่างอิสระเพื่อเน้นโครงสร้างตลาดเฉพาะ
กระบวนการสร้างรูปแบบ 🎨
ขั้นตอนที่ 1 - การเก็บรวบรวมจุดหมุน:
- ระบบรวบรวม 5 หรือ 6 จุดสวิงล่าสุด จากตัวตรวจจับที่ใช้งานใดก็ได้
- จุดต้องสลับกันระหว่างสูงและต่ำ (โครงสร้างซิกแซก)
- ตัวอย่าง 5 จุด: สูง → ต่ำ → สูง → ต่ำ → สูง
ขั้นตอนที่ 2 - การสร้างเส้นแนวโน้ม:
- แยกจุดหมุนเป็นจุดบน (สวิงสูง) และจุดล่าง (สวิงต่ำ)
- วาดเส้นแนวโน้มสองเส้น: ขอบบนและขอบล่าง
- สำหรับขอบเขต 3 จุด: ทดสอบ 3 การจับคู่ (0-2, 0-1, 1-2) และเลือกที่เหมาะสมที่สุด ⭐
- ตรวจสอบว่าเส้นแนวโน้มไม่ทะลุผ่านตัวแท่งเทียน (อนุญาตเฉพาะไส้เทียน)
- คำนวณคะแนนความเหมาะสม: เส้นต้องสัมผัสแท่งเทียนน้อยกว่า 20% ระหว่างจุดหมุน
ขั้นตอนที่ 3 - การวิเคราะห์เรขาคณิต:
- วัดมุมความสัมพันธ์ระหว่างขอบบนและขอบล่าง
- กำหนดว่ารูปแบบเป็น ขยายออก (กว้างขึ้น), หดตัว (แคบลง), หรือ ขนาน (ความกว้างคงที่)
- ระบุทิศทางแนวโน้ม: ขึ้น, ลง, หรือเป็นกลาง (แนวนอน)
- จัดประเภทเป็นหนึ่งใน 14 ประเภทของรูปแบบ ตามเรขาคณิต
ขั้นตอนที่ 4 - การตรวจสอบและกรอง:
- ตรวจสอบสัดส่วนแท่งเทียน: ตรวจสอบว่าช่องว่างระหว่างสวิงมีสัดส่วนเหมาะสม (ป้องกันรูปแบบบิดเบี้ยว) ✅
- ป้องกันการทับซ้อน: บล็อกรูปแบบใหม่ที่ขัดแย้งกับรูปแบบที่มีอยู่ 🚫
- ตรวจสอบซ้ำ: ป้องกันการวาดรูปแบบเดิมซ้ำ
- กรองจุดหมุนสุดท้าย: แสดงเฉพาะรูปแบบที่จบด้วยทิศทางจุดหมุนที่กำหนด (ขึ้น/ลง/ทั้งสอง)
- กรองประเภทของรูปแบบ: เปิด/ปิดหมวดหมู่รูปแบบเฉพาะ
ขั้นตอนที่ 5 - การแสดงผล:
- วาดเส้นขอบบนและขอบล่างด้วยสีสันสดใสจากพาเลตต์สี 12 สี 🎨
- แสดงเส้นสวิงซิกแซกเชื่อมจุดหมุน (เส้นประสีน้ำเงิน) เป็นทางเลือก
- แสดงหมายเลขจุดหมุน (1, 2, 3, 4, 5) ที่แต่ละจุดสวิง
- ติดป้ายชื่อรูปแบบด้วยชื่อรูปแบบที่จุดหมุนสุดท้าย
- ใช้สีพื้นหลังหลังป้ายเพื่อความชัดเจน
📐 14 รูปแบบที่ตรวจจับได้
ช่องทาง (รูปแบบขนาน) 📦
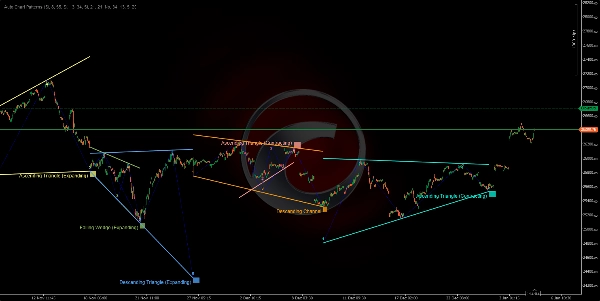
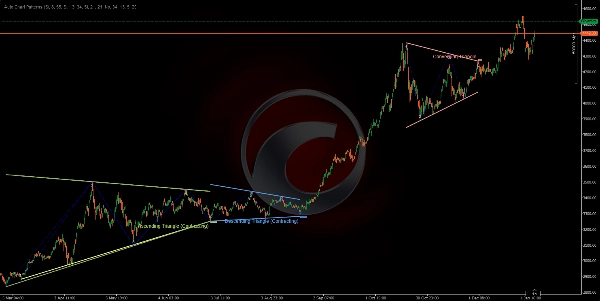
- ช่องทางขาขึ้น (ขนานขึ้น) 📈
-
- ขอบเขตทั้งสองลาดขึ้นที่มุมใกล้เคียงกัน
- บ่งชี้แนวโน้มต่อเนื่องขาขึ้น
- เทรด: ซื้อที่ขอบเขตล่าง, ขายที่ขอบเขตบน
- ช่องทางขาลง (ขนานลง) 📉
-
- ขอบเขตทั้งสองลาดลงที่มุมใกล้เคียงกัน
- บ่งชี้แนวโน้มต่อเนื่องขาลง
- เทรด: ขายที่ขอบเขตบน, ซื้อที่ขอบเขตล่าง
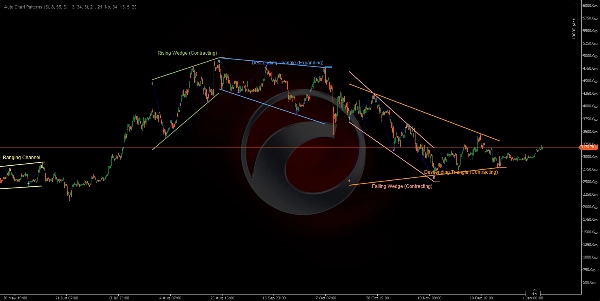
- ช่องทางแนวราบ (ด้านข้าง/แนวนอน) ↔️
-
- ขอบเขตทั้งสองเกือบแนวนอน
- บ่งชี้การรวมตัวหรือความไม่แน่นอน
- เทรด: กลยุทธ์ในช่วงกรอบ, ซื้อที่แนวรับ/ขายที่แนวต้าน
เวดจ์ขยายตัว (รูปแบบกว้างขึ้น) 📣
4. เวดจ์ขาขึ้น (ขยายตัว) ⚠️
* ขอบเขตทั้งสองลาดขึ้น พร้อมช่องว่างที่กว้างขึ้น
* รูปแบบกลับตัวขาลง - ราคาสูญเสียโมเมนตัมขาขึ้น
* เทรด: รอการเบรกขอบเขตล่าง, เข้าทำรายการสั้น
5. เวดจ์ขาลง (ขยายตัว) ⚠️
* ขอบเขตทั้งสองลาดลง พร้อมช่องว่างที่กว้างขึ้น
* รูปแบบกลับตัวขาขึ้น - ราคาสูญเสียโมเมนตัมขาลง
* เทรด: รอการเบรกขอบเขตบน, เข้าทำรายการยาว
6. สามเหลี่ยมแยกตัว (สามเหลี่ยมกว้างขึ้น) 🔺
* ขอบเขตบนลาดขึ้น, ขอบเขตล่างลาดลง
* รูปแบบขยายความผันผวนสูง
* เทรด: เสี่ยงสูงมาก, รอการเบรกทิศทางที่ชัดเจน
7. สามเหลี่ยมขาขึ้น (ขยายตัว) 📊
* ขอบเขตบนแนวนอน, ขอบเขตล่างลาดขึ้น
* ต่อเนื่องขาขึ้นพร้อมช่วงขยาย
* เทรด: ซื้อเมื่อเบรกขอบเขตบน
8. สามเหลี่ยมขาลง (ขยายตัว) 📊
* ขอบเขตล่างแนวนอน, ขอบเขตบนลาดลง
* ต่อเนื่องขาลงพร้อมช่วงขยาย
* เทรด: ขายเมื่อเบรกขอบเขตล่าง
เวดจ์หดตัว (รูปแบบบีบตัว) 🔻
9. เวดจ์ขาขึ้น (หดตัว) 🔺
* ขอบเขตทั้งสองลาดขึ้น พร้อมช่องว่างที่แคบลง
* รูปแบบกลับตัวขาลง - หมดแรงขาขึ้น ⚠️
* เทรด: เข้าทำรายการสั้นเมื่อเบรกขอบเขตล่าง
10. เวดจ์ขาลง (หดตัว) 🔻
* ขอบเขตทั้งสองลาดลง พร้อมช่องว่างที่แคบลง
* รูปแบบกลับตัวขาขึ้น - หมดแรงขาลง ⚠️
* เทรด: เข้าทำรายการยาวเมื่อเบรกขอบเขตบน
สามเหลี่ยมหดตัว (รูปแบบรวมตัว) △
11. สามเหลี่ยมบีบตัว (สามเหลี่ยมสมมาตร) ⚖️
* ขอบเขตบนลาดลง, ขอบเขตล่างลาดขึ้นที่อัตราใกล้เคียงกัน
* การรวมตัวแบบเป็นกลาง - รูปแบบต่อเนื่อง
* เทรด: รอทิศทางเบรกเอาท์, เทรดตามนั้น
12. สามเหลี่ยมขาลง (หดตัว) 📐
* ขอบเขตล่างแนวนอน (แนวรับ), ขอบเขตบนลาดลง
* รูปแบบต่อเนื่องขาลง 🔴
* เทรด: เข้าทำรายการสั้นเมื่อแนวรับถูกเบรกพร้อมปริมาณ
13. สามเหลี่ยมขาขึ้น (หดตัว) 📐
* ขอบเขตบนแนวนอน (แนวต้าน), ขอบเขตล่างลาดขึ้น
* รูปแบบต่อเนื่องขาขึ้น 🟢
* เทรด: เข้าทำรายการยาวเมื่อแนวต้านถูกเบรกพร้อมปริมาณ
14. ไม่ถูกต้อง/ไม่ทราบ ❌
* รูปแบบที่ไม่ตรงตามเกณฑ์เรขาคณิต
* ถูกกรองออกโดยอัตโนมัติ
สรุป
Key functionalities include identifying potential breakout zones, visualizing market structure through geometric price relationships, and supporting trading of continuation and reversal patterns with visual confirmation. Users can filter detected patterns by trend direction, pivot type, and formation category. The indicator prevents overlapping and duplicate patterns to maintain clarity.
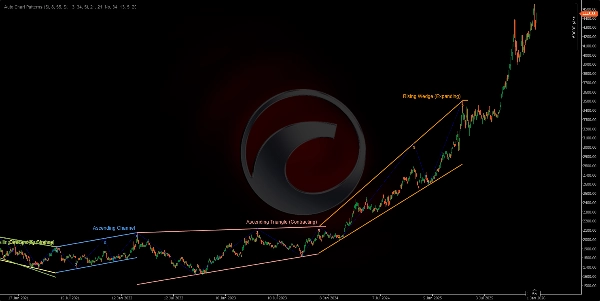
The 14 detected formations cover a range of classical patterns such as ascending, descending, and ranging channels; expanding and contracting wedges; and various triangle types (converging, diverging, ascending, descending). Visual outputs include color-coded boundary lines, pivot numbering, zigzag swing lines, and labeled pattern names for easy interpretation. This tool supports analysis across multiple markets including Forex, stocks, commodities, indices, and cryptocurrencies.
รีวิวจากลูกค้า
5 | 50 % | |
4 | 50 % | |
3 | 0 % | |
2 | 0 % | |
1 | 0 % |


