
Descripción
Cómo operar usando la estrategia Donchian (ruptura)
- Comprar cuando el precio rompe el máximo de N períodos (Superior).
- Vender cuando el precio rompe el mínimo de N períodos (Inferior).
- Mantener la posición mientras la tendencia continúe; salir en una ruptura opuesta o mediante un stop móvil.
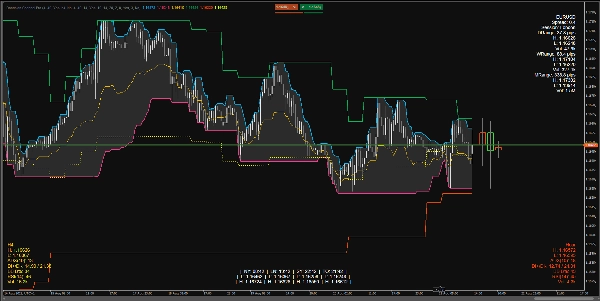
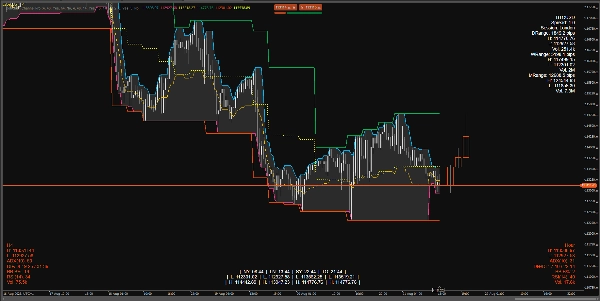
Qué muestra el indicador en el gráfico
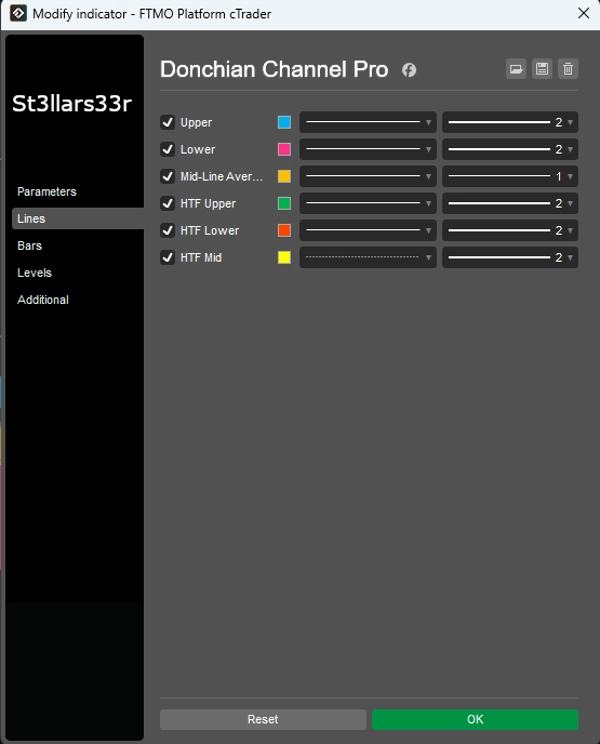
Donchian en el marco temporal actual (TF):
- Superior: El precio más alto sobre las barras del canal superior.
- Inferior: El precio más bajo sobre las barras del canal inferior.
- Medio: El punto medio entre Superior e Inferior.
Superposición HTF: Líneas Donchian de un marco temporal superior superpuestas en el gráfico:
- HTF Superior, HTF Inferior, HTF Medio
- HTF Velas HUD: Rectángulos que representan velas de un marco temporal superior, anclados a la derecha de la última barra en el TF actual.
HUDs (Pantallas de visualización) en la parte inferior/superior:
- SuperiorDerecha: Panel de información para el símbolo + rangos diarios/semanales/mensuales.
- InferiorIzquierda: HUD HTF (métricas para el marco temporal superior).
- InferiorDerecha: HUD TF Medio (métricas para el marco temporal intermedio).
- InferiorCentro: Relojes de sesión + Máximo/Mínimo para cada sesión (persistente).
Qué muestra cada HUD
SuperiorDerecha (Parte superior derecha)
- NombreSímbolo
- Spread: Spread en pips.
- Sesión: Sesión activa actual (basada en horas especificadas).
- RangoD/RangoS/RangoM: Rango diario/semanal/mensual en pips.
- Máx/Mín/Vol: Máximo/Mínimo y volumen total para el período respectivo.
InferiorIzquierda (Parte inferior izquierda) — HUD HTF
- Nombre TF (p. ej., H4, D1, etc.)
- Máx/Mín: Máximo/mínimo actual de la última barra HTF (o activa).
- ADX(n), DI+/DI-: Indicadores de tendencia.
- BB B%: Dónde está el precio actual relativo a las Bandas de Bollinger en HTF (0 cerca de la banda inferior, 100 cerca de la banda superior).
- RSI(n)
- Vol: Volumen en HTF.
- Color HUD:
-
- Verde: Rango expandiéndose hacia arriba (DI+ y ADX en aumento).
- Rojo: Presión descendente creciente (DI- en aumento).
- Amarillo: Neutral/indefinido.
InferiorDerecha (Parte inferior derecha) — HUD TF Medio
- Igual que el HUD HTF, pero para el marco temporal intermedio (TF Medio).
InferiorCentro (Centro inferior) — Relojes + Máx/Mín de sesión
- Hora en NY, LN, SY, TO.
- Mín/Máx para cada sesión.
- Lógica persistente: Cuando una sesión está inactiva, muestra el Máx/Mín de la última sesión completada; cuando comienza una nueva sesión, los valores se reinician y recalculan.
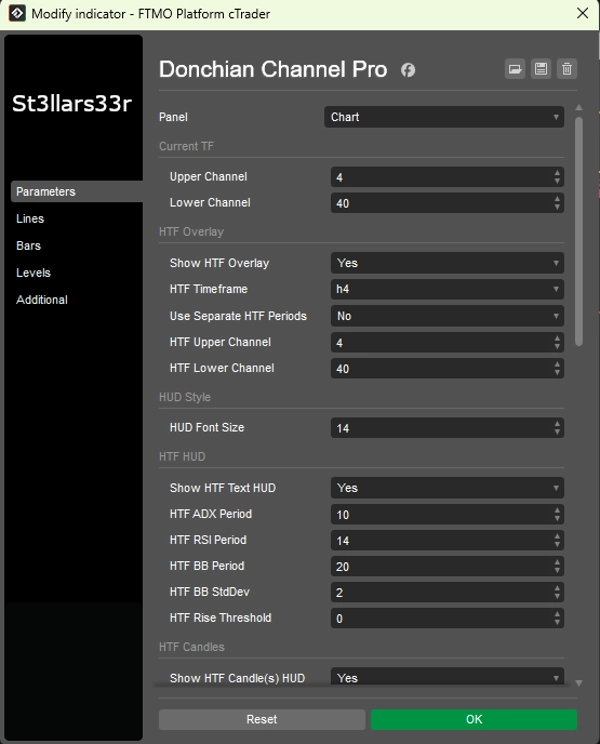
Parámetros y cómo usarlos
Grupo: TF actual (Donchian actual)
- Canal superior: Número de barras para el canal superior. Valor mayor = actualizaciones menos frecuentes, línea más plana.
- Canal inferior: Número de barras para el canal inferior.
Grupo: Superposición HTF (Superposición Donchian de marco temporal superior)
- Mostrar superposición HTF: Habilita líneas HTF en el gráfico.
- Marco temporal HTF: Seleccionar marco temporal superior (p. ej., Hora4).
- Usar períodos HTF separados: Si es verdadero, HTF Superior/Inferior usan sus propios parámetros; si es falso, usa Superior/Inferior actual.
- Canal superior HTF: Longitud del canal superior para HTF.
- Canal inferior HTF: Longitud del canal inferior para HTF.
Grupo: Estilo HUD
- Tamaño de fuente HUD: Tamaño de fuente para todos los HUDs (SuperiorDerecha, InferiorIzquierda, InferiorDerecha, InferiorCentro).
Grupo: HUD HTF (Inferior izquierda)
- Mostrar HUD de texto HTF: Mostrar HUD de texto para HTF.
- Período ADX HTF: Período ADX/DI. Mayor = más suave, menos ruido, pero respuesta más lenta.
- Período RSI HTF: Período RSI.
- Período BB HTF: Período de Bandas de Bollinger.
- Desviación estándar BB HTF: Multiplicador de desviación estándar para BB (el clásico es 2.0).
- Umbral de subida HTF: Sensibilidad a métricas ascendentes (afecta el color del HUD).
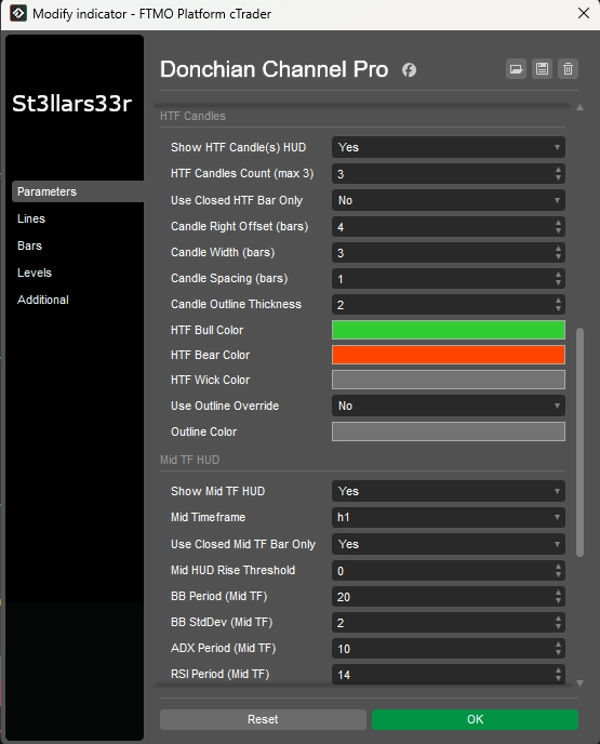
Grupo: Velas HTF (Derecha, cerca de la última barra)
- Mostrar HUD de vela(s) HTF: Mostrar velas HTF a la derecha.
- Cantidad de velas HTF (máx. 3): Número de velas HTF (1–3).
- Usar solo barra HTF cerrada: Si es verdadero, usa solo velas HTF cerradas (valores estables). Si es falso, incluye la vela abierta actual.
- Desplazamiento derecho de vela (barras): Desplazamiento hacia la derecha en barras del TF actual desde la última barra (ancla).
- Ancho de vela (barras): Ancho del rectángulo de la vela en barras del TF actual.
- Espaciado entre velas (barras): Espacio entre velas.
- Grosor del contorno de vela: Grosor de los contornos de las velas.
- Color toro HTF / Color oso HTF: Colores para velas alcistas/bajistas.
- Color mecha HTF: Color para las mechas.
- Usar anulación de contorno: Si es verdadero, el cuerpo de la vela se dibuja con un contorno (Color de contorno) sin relleno toro/oso.
- Color de contorno: Color para el contorno cuando Usar anulación de contorno = verdadero.
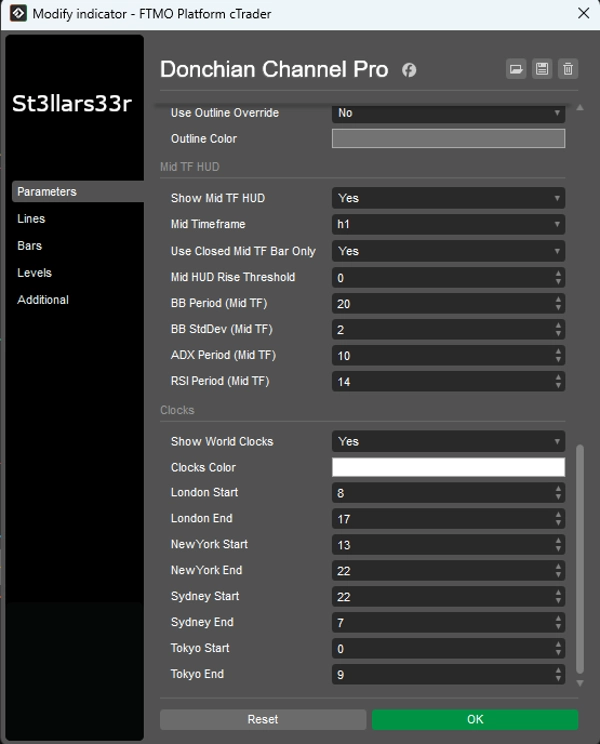
Grupo: HUD TF Medio (Inferior derecha)
- Mostrar HUD TF Medio: Habilita HUD para el TF intermedio.
- TF Medio: Seleccionar TF intermedio (p. ej., Minuto15).
- Usar solo barra TF Medio cerrada: Igual que HTF, pero para TF Medio.
- Umbral de subida HUD Medio: Sensibilidad de color para HUD TF Medio.
- Período BB (TF Medio), Desviación estándar BB (TF Medio): Configuraciones de Bandas de Bollinger para TF Medio.
- Período ADX (TF Medio), Período RSI (TF Medio): Períodos ADX y RSI para TF Medio.
Grupo: Relojes (Centro inferior)
- Mostrar relojes mundiales: Mostrar bloque con relojes y Máx/Mín de sesión.
- Color de relojes: Color de texto para relojes/sesiones.
- Inicio Londres / Fin Londres: Horas de inicio/fin para la sesión de Londres.
- Inicio Nueva York / Fin Nueva York: Para Nueva York.
- Inicio Sídney / Fin Sídney: Para Sídney.
- Inicio Tokio / Fin Tokio: Para Tokio.
Relojes: Mostrar hora local real para ciudades (a través de zonas horarias del SO con un desplazamiento de respaldo).
- Los cálculos de actividad de sesión (y Máx/Mín) usan la hora del servidor del broker (Server.Time). Si el servidor no está en UTC, las horas de sesión pueden desplazarse—ajuste Inicio/Fin según sea necesario para su servidor.
- Si una sesión cruza la medianoche (Fin < Inicio), el indicador automáticamente considera la transición de fecha.
- Cuando una sesión está inactiva, se muestra el Máx/Mín de la última sesión completada; cuando comienza una nueva sesión, los datos se reinician y recalculan.
Resumen
Valoraciones de clientes
5 | 50 % | |
4 | 50 % | |
3 | 0 % | |
2 | 0 % | |
1 | 0 % |


