
Sniper Zone Pro
Indicador
3 compras
Versión 1.0, Jan 2026
Windows, Mac
4.6
Valoraciones: 3
Descripción
Indicador Sniper Zone Pro
El Sniper Zone Pro es una herramienta avanzada de análisis diseñada para identificar visualmente la huella de grandes instituciones en el gráfico de precios. Combina el mapeo de zonas de indecisión pasadas con un sistema de coloreado de velas que expone movimientos de manipulación y la fuerza institucional. El indicador transforma el caos del mercado en regiones operativas claras, permitiendo a los traders identificar exactamente dónde el precio "luchó" y dónde tiende a probar antes de una nueva expansión.
Características clave del Sniper Zone Pro
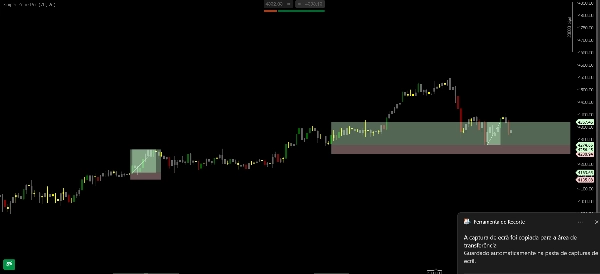
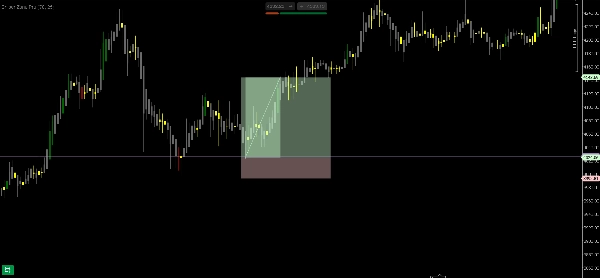
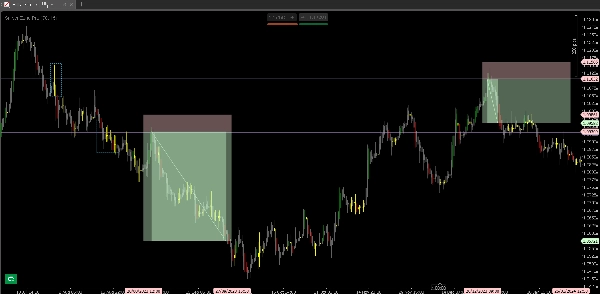
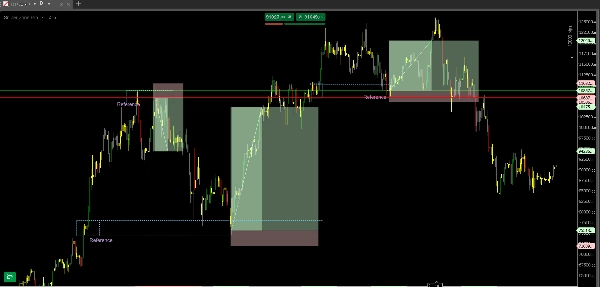
- Mapeo de "Zonas de Batalla": Identifica automáticamente áreas de indecisión donde el precio acumuló volumen. Estas regiones se convierten en "zonas operativas" cruciales, ya que representan niveles de precio con disputas significativas entre compradores y vendedores.
- Coloreado Institucional Activo: El sistema de colores no es meramente estético; resalta velas con características de movimiento institucional (como alto volumen o absorción), separando el ruido del mercado de las intenciones de los grandes jugadores.
- Zonas de Prueba de Alta Probabilidad: Al alcanzar una región clave, el indicador ayuda a visualizar si el precio solo está probando la zona o está listo para romperla, ofreciendo disparadores de entrada mucho más precisos.
- Filtro de Jerarquía (HTF): Prioriza zonas de interés en marcos temporales superiores, donde las batallas de precio tienen mayor relevancia técnica y el potencial de retorno es significativamente mayor.
¿Por qué usar el Sniper Zone Pro?
- Lectura de la Intención del Mercado: Al observar los colores de las velas dentro de las zonas de batalla, los traders pueden identificar si las instituciones están defendiendo esa posición o abandonándola.
- Definición de Zonas Operativas: Elimina la duda de "dónde operar". El indicador muestra que las mejores oportunidades no se encuentran en medio de un movimiento, sino en las pruebas de regiones donde el precio mostró indecisión previamente.
- Reducción de la Subjetividad: Los traders dejan de intentar "adivinar" máximos y mínimos y comienzan a operar basándose en áreas probadas de interés profesional.
Resumen
Resumen de IA
Sniper Zone Pro is an advanced trading indicator designed to visually identify institutional activity on price charts by mapping past indecision zones and applying a candle coloring system that highlights market manipulation and institutional strength. It automatically detects "battle zones" where price accumulated volume, marking key operational areas of buyer-seller disputes. The indicator’s color-coded candles reveal institutional movements such as high volume or absorption, helping traders distinguish significant market actions from noise. It also highlights high-probability test zones, indicating whether price is testing or ready to break through these critical levels. A hierarchy filter prioritizes zones from higher timeframes, emphasizing areas with greater technical relevance. Sniper Zone Pro supports multiple markets including Forex, cryptocurrencies, stocks, commodities, and indices, with tags referencing symbols like BTCUSD, EURUSD, GBPUSD, XAUUSD, NAS100, and USDJPY. The tool aids traders in reading market intent by showing institutional defense or abandonment of price levels, defining precise operating zones to reduce subjectivity, and focusing trading decisions on professional interest areas rather than arbitrary price points.
Perfil del indicador
Valoraciones de clientes
4.6
Valoraciones: 3
5 | 67 % | |
4 | 33 % | |
3 | 0 % | |
2 | 0 % | |
1 | 0 % |
Valoraciones de clientes
January 19, 2026
The best part is random clicks become easier to catch, and a 1R exit plan makes review easier.
January 14, 2026
H1 makes the signal less noisy, and it adds a useful layer without forcing action.
January 5, 2026
No reason to yolo this live without a few normal sessions. The result needs a journal.
Conversación
Preguntas frecuentes
BTCUSD
Forex
Signal
Breakout
Indices
EURUSD
Commodities
GBPUSD
NZDUSD
Scalping
Crypto
Stocks
XAUUSD
NAS100
USDJPY
Los productos disponibles a través de cTrader Store, incluidos bots, indicadores y plugins para operar, son proporcionados por desarrolladores de terceros y están disponibles únicamente con fines informativos y de acceso técnico. cTrader Store no es un bróker, por lo que no proporciona asesoramiento de inversión, recomendaciones personales ni ninguna garantía de rentabilidad futura.


Precio
Desde 11/07/2025
3
Ventas