
Market Entropy
Indicador
107 descargas
Versión 1.0, Aug 2025
Windows, Mac
Desde 26/05/2025
388.58M
Volumen operado
60.75K
Pips ganados
15
Ventas
1.41K
Instalaciones gratis
Descripción
Entropía del Mercado es un indicador dual (oscilador + superposición de precio opcional) que cuantifica la organización del mercado y señala cambios de régimen a lo largo de Orden → Transición → Caos. Añade una segunda línea, Tendencia (DC), para separar tendencia verdadera de compresión de volatilidad.
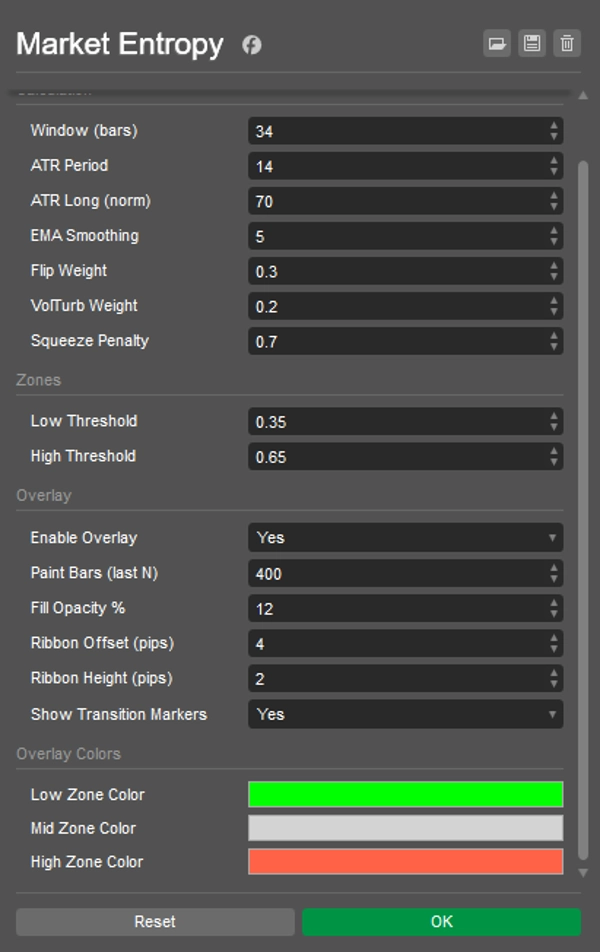
Cómo funciona:
- Usa solo componentes OHLCV: DC (consistencia direccional), FlipRate (cambios de signo), Volatility_n (ATR/ATRlong), VolumeTurb (desviación estándar de ΔVolumen).
- Entropía bruta:
E0 = 0.5*(1-DC) + 0.3*(FlipRate*VolN) + 0.2*VolumeTurb). - El término anti-compresión reduce E durante compresiones ATR → entropía final ∈ [0..1] con suavizado EMA.
- Marcadores:
-
- CRISTAL — cruce por debajo de LowThr (emerge el orden: tendencia o compresión previa a ruptura).
- DISOLVER — cruce por encima de HighThr (se rompe el orden: decadencia del caos/tendencia).
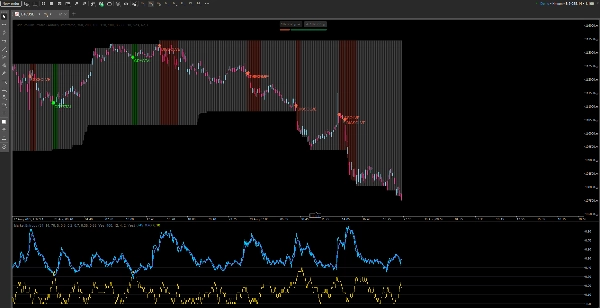
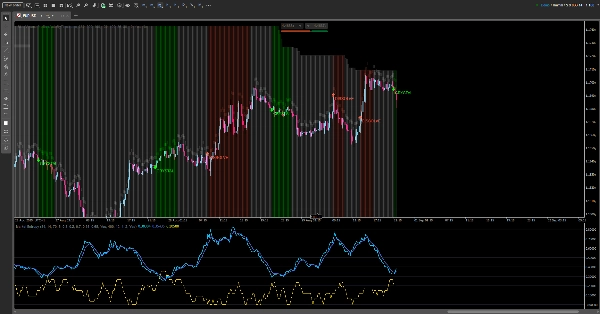
Lo que ves:
- En el panel: Entropía, Entropía(EMA), Tendencia (DC), umbrales Bajo/Alto, fondo de zona.
- En el gráfico (activable): barras coloreadas por estado, una cinta delgada sobre los máximos, y marcadores CRISTAL/DISOLVER.
Guía de lectura:
- E < LowThr → Orden:
-
- con alto DC → tendencia organizada;
- con bajo ATR → compresión (se espera ruptura).
- LowThr…HighThr → Transición: estructura en formación; espera resolución.
- E > HighThr → Caos: incertidumbre / desgaste de la tendencia; evita entradas ingenuas de continuación.
Estrategias:
- Compresión → CRISTAL → Ruptura/Reprueba — opera la ruptura.
- Tendencia → DISOLVER — reduce posición o ajusta riesgo.
Resumen
Perfil del indicador
Valoraciones de clientes
0.0
Valoraciones: 0
Valoraciones de clientes
Este producto todavía no se ha valorado. ¿Ya lo ha probado? Sea el primero en informar a otros.
Conversación
Preguntas frecuentes
Los productos disponibles a través de cTrader Store, incluidos bots, indicadores y plugins para operar, son proporcionados por desarrolladores de terceros y están disponibles únicamente con fines informativos y de acceso técnico. cTrader Store no es un bróker, por lo que no proporciona asesoramiento de inversión, recomendaciones personales ni ninguna garantía de rentabilidad futura.


Precio
Desde 26/05/2025
388.58M
Volumen operado
60.75K
Pips ganados
15
Ventas
1.41K
Instalaciones gratis