

present
Zarejestruj się i otrzymaj 50 $ zniżki na pierwszy zakup
Trading product for MACD  -  advanced Wskaźnik BTCUSD Forex, image 1
MACD - advanced
Wskaźnik
5 zakupy
Wersja 1.0, Mar 2026
Windows, Mac
4.3
Opinie: 6
Trading product for MACD  -  advanced Wskaźnik BTCUSD Forex, image 2
Trading product for MACD  -  advanced Wskaźnik BTCUSD Forex, image 3
Trading product for MACD  -  advanced Wskaźnik BTCUSD Forex, image 4
Trading product for MACD  -  advanced Wskaźnik BTCUSD Forex, image 5
Trading product for MACD  -  advanced Wskaźnik BTCUSD Forex, image 6
Trading product for MACD  -  advanced Wskaźnik BTCUSD Forex, image 7
Trading product for MACD  -  advanced Wskaźnik BTCUSD Forex, image 8
29
Sprzedaż
812
Bezpłatne instalacje

Opis

MACD Advanced — Opis wskaźnika

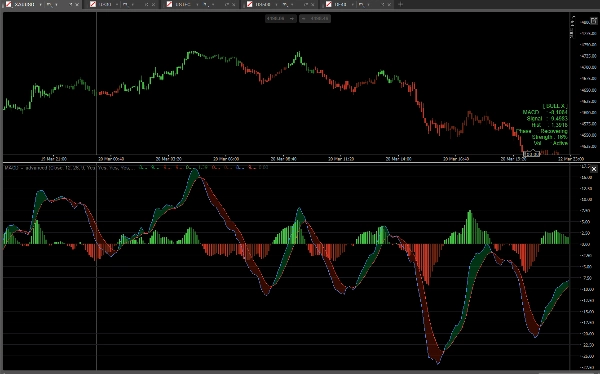
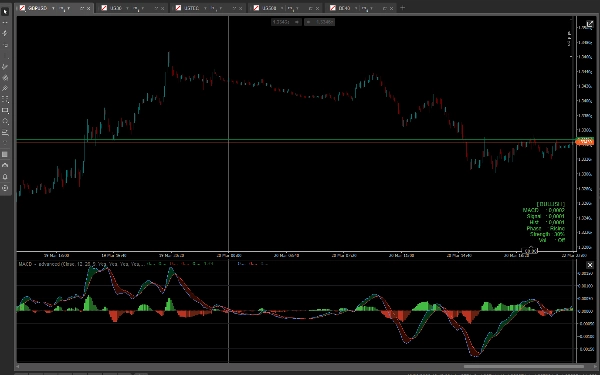
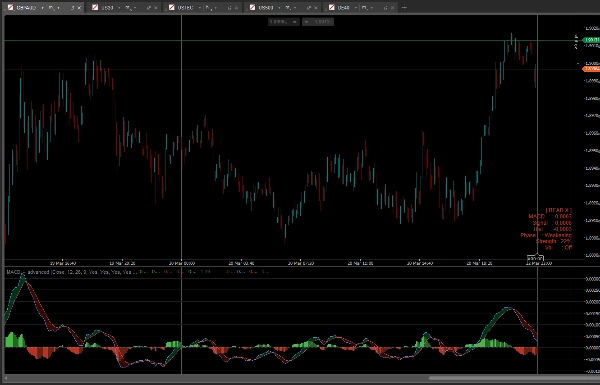
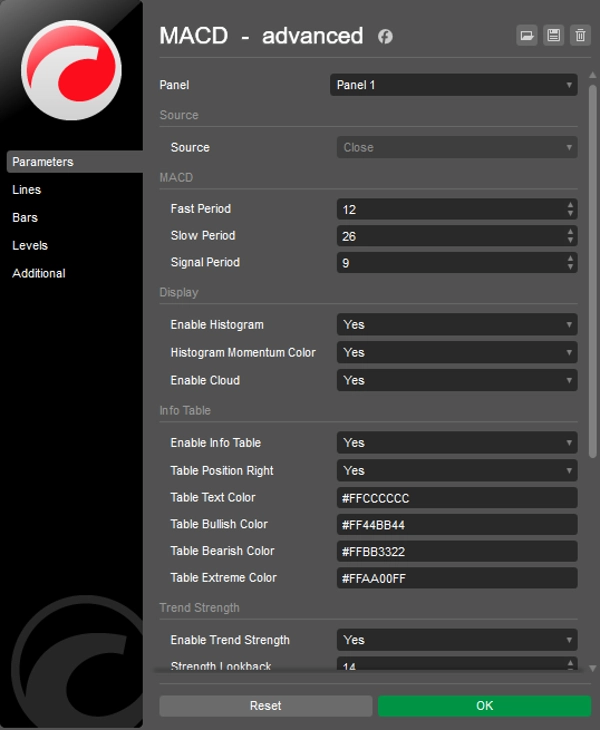
MACD Advanced to profesjonalna wersja klasycznego wskaźnika MACD dla cTrader. Łączy standardową logikę MACD z bogatym zestawem narzędzi wizualnych i warstw analitycznych, dając traderom znacznie głębszy wgląd w momentum rynku, siłę trendu oraz warunki zmienności — wszystko w jednym panelu.


Histogram z kolorowaniem momentum

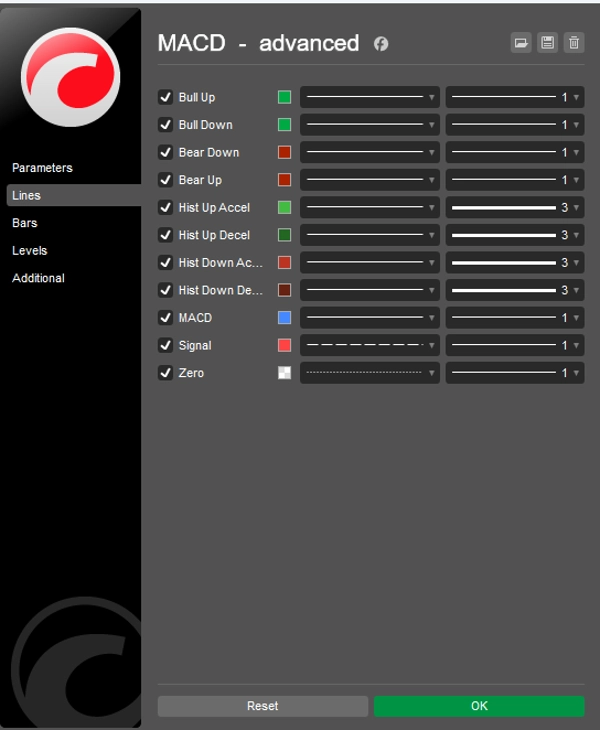
Histogram pokazuje różnicę między liniami MACD i Signal oraz używa czterech oddzielnych kolorów, aby rozróżnić cztery stany rynku: byczy przyspieszający, byczy zwalniający, niedźwiedzi przyspieszający i niedźwiedzi zwalniający. Dzięki temu od razu widać, czy momentum rośnie, czy słabnie, bez konieczności ręcznych obliczeń.


Chmura MACD

Opcjonalna chmura wypełnia obszar pomiędzy liniami MACD i Signal. Zielona chmura tworzy się, gdy MACD jest powyżej Signal (byczy sentyment), a czerwona, gdy MACD jest poniżej Signal (niedźwiedzi sentyment). Chmura daje natychmiastowy wizualny odczyt kierunku trendu na pierwszy rzut oka.


Siła trendu

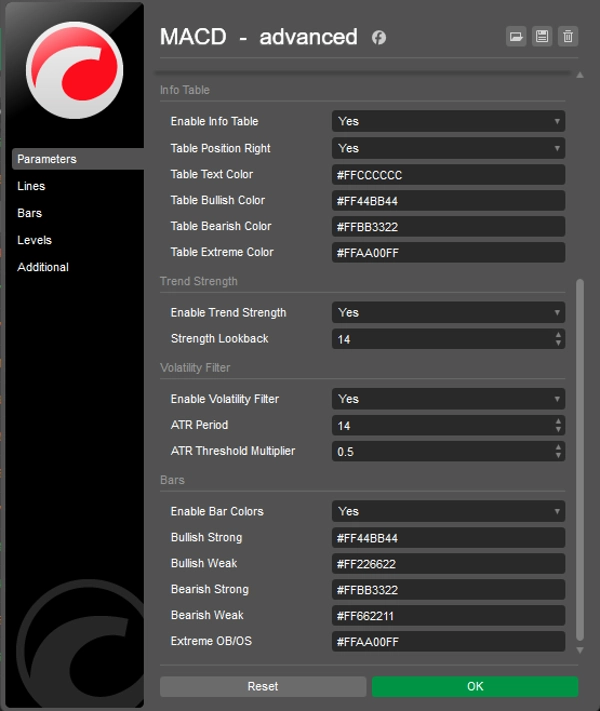
Wskaźnik oblicza w czasie rzeczywistym wynik siły trendu na podstawie odległości między liniami MACD i Signal w konfigurowalnym okresie wstecz. Wynik jest wyświetlany jako procent w tabeli informacyjnej, pomagając ocenić, jak silny lub słaby jest obecny ruch.


Filtr zmienności

Opcjonalny filtr zmienności oparty na ATR tłumi sygnały podczas okresów niskiej zmienności. Po włączeniu słupki histogramu i ich kolory zmieniają się na neutralny szary, gdy zmienność spada poniżej konfigurowalnego progu, zapobiegając fałszywym odczytom na spokojnych rynkach.


Tabela informacyjna

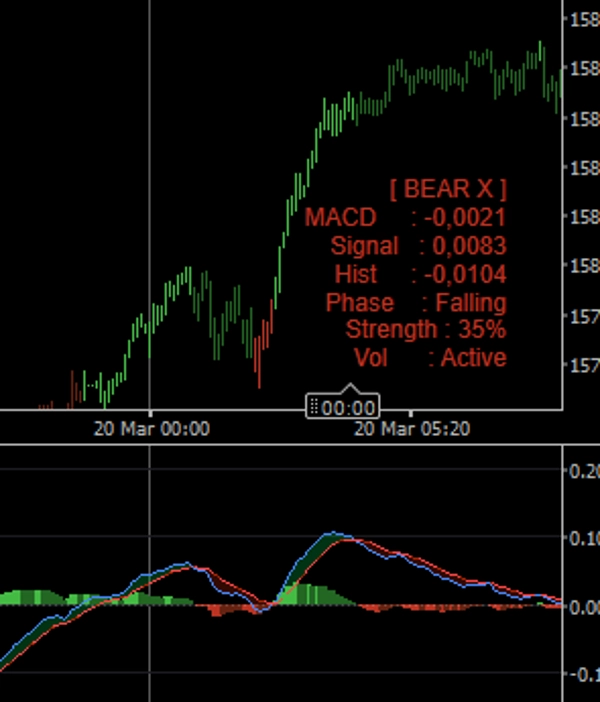
Kompaktowa tabela na wykresie wyświetla aktualny stan rynku (Byczy, Niedźwiedzi, Bycze przecięcie, Niedźwiedzie przecięcie, Neutralny), dokładne wartości MACD i Signal, wartość histogramu, fazę cyklu (Rosnąca, Słabnąca, Odzyskująca, Opadająca), procent siły trendu oraz status filtra zmienności. Pozycja tabeli (lewa lub prawa) oraz wszystkie kolory są w pełni konfigurowalne.


Kolorowanie słupków

Po włączeniu wskaźnik zmienia kolor świec na wykresie na podstawie warunków MACD: silny byczy, słaby byczy, słaby niedźwiedzi, silny niedźwiedzi oraz niska zmienność. Dzięki temu sygnał MACD jest bezpośrednio widoczny na wykresie cenowym bez przełączania paneli.


Podsumowanie kluczowych cech

  • Czterokolorowy histogram momentum
  • Chmura MACD między liniami MACD i Signal
  • Wynik siły trendu w czasie rzeczywistym wyrażony w procentach
  • Filtr zmienności oparty na ATR z wizualnym wsparciem
  • Tabela informacyjna na wykresie z pełnym podziałem stanu rynku
  • Opcjonalne kolorowanie świec na podstawie warunków MACD
  • Wszystkie kolory w pełni konfigurowalne z obsługą kanału alfa
  • Czysty i lekki — bez przerysowywania

Podsumowanie

Podsumowanie AI
MACD Advanced is a professional indicator for cTrader that enhances the classic MACD by integrating multiple visual and analytical tools into a single panel. It provides a detailed view of market momentum, trend strength, and volatility. Key features include a four-color momentum histogram that distinguishes between bullish and bearish acceleration or deceleration, and an optional MACD cloud that visually indicates trend direction by shading the area between the MACD and Signal lines in green or red. The indicator calculates a real-time trend strength score as a percentage based on the MACD and Signal line separation over a configurable period. An optional ATR-based volatility filter suppresses signals during low-volatility phases by changing histogram colors to neutral grey, reducing false signals. A compact on-chart info table displays current market state, MACD and Signal values, histogram data, cycle phase, trend strength, and volatility filter status, with customizable position and colors. Additionally, candle bars can be recolored based on MACD conditions to reflect strong or weak bullish/bearish trends and low volatility directly on the price chart. All colors support alpha channel customization. The indicator is designed to be clean, lightweight, and free from repainting. It supports various markets including Forex, indices, commodities, stocks, and cryptocurrencies.
Profil wskaźnika

Opinie klientów

4.3
Opinie: 6
5
33 %
4
67 %
3
0 %
2
0 %
1
0 %
Opinie klientów
April 6, 2026
April 4, 2026
April 1, 2026
the best part is the process slows down in a good way, and a 1R exit plan makes review easier.
March 28, 2026
Helps more when the trader avoids forced trades. Account protection still comes first.
March 27, 2026
Solid enough as a backup opinion. It is just a support layer.
March 25, 2026
Fine for a side read, especially when the chart is not clean. It can add noise if overused.

Dyskusja

Częste pytania

BTCUSD
Forex
Signal
Indices
EURUSD
Commodities
GBPUSD
NZDUSD
Prop
Scalping
Crypto
Stocks
XAUUSD
NAS100
ATR
MACD
USDJPY
Produkty dostępne za pośrednictwem cTrader Store, w tym boty handlowe, wskaźniki i wtyczki, dostarczane są przez deweloperów zewnętrznych i udostępniane wyłącznie w celach informacyjnych oraz w celu zapewnienia dostępu technicznego. cTrader Store nie jest brokerem i nie zapewnia doradztwa inwestycyjnego, nie udziela spersonalizowanych rekomendacji ani nie gwarantuje przyszłych wyników.

Więcej od tego autora

Wskaźnik
AI
Prop
+8
The EMA Trend Simple is a trend-following tool designed for simplicity and visual clarity.
cBot
Prop Firm Fit
Stop Loss (SL) Manager
+1
HTS Strategy Tester - Advanced Multi-Timeframe Trend & Pullback Trading System H1/m1 & H4/m5 WWS 33/144 Start from 100$
90.1%
ROI
2.92
Współczynnik zysku
Wskaźnik
AI
Grid
+7
Follow The Trend cBot - INDICATOR - displays two Moving Average Bands for cBot or for your own use
Wskaźnik
AI
SMC
+7
The ultimate tool for Price Action and ICT. High, Low and Mid levels for days, weeks Inc. NY Midnight and Custom Range.
Wskaźnik
ATR
Prop
+13
HCCC MTF (Hurst Cycle Composite Channel), Designed for Semi-Automated Trading, Interactive MTF Dashboard
Wskaźnik
AI
RSI
+7
EMA MTF TREND PRO - Multi-timeframe trend analysis overlay indicator, 6 timeframes - in one table with ADX
Wskaźnik
Key Levels
TP_SL Very useful Risk & Reward Tool. Bring the ultimate TradingView-style Long/Short Position
Wskaźnik
AI
SMC
+4
Weekly Daily Opening Gaps — NWOG & NDOG Indicator Professional-grade opening gap visualization for institutional traders
Wskaźnik
AI
Prop
+7
EMA Clouds, Multi-Timeframe (MTF) Overlay, Swing High/Low detection, and a smart Dashboard with neutral zone filtering.
Wskaźnik
ATR
Channel
+1
Bollinger Bands Advanced Squeeze & Breakout System, Real-Time On-Chart Dashboard, Auto-Squeeze Detector, Dual-Band Cloud
Logo „RSI Advanced”
Najwyżej oceniane
5.0
(4)
$20
/
$30
Wskaźnik
AI
ATR
+12
The standard Relative Strength Index (RSI), RSI & Signal Cloud, Smart Volatility Filter (ATR), On-Chart Info Dashboard
Wskaźnik
SMC
Prop
+11
Sessions PRO is a professional session visualization indicator - 4 Fully Customizable Sessions

Możesz także polubić

Wskaźnik
BOS
CHOCH
+5
A professional-grade cTrader indicator for traders following the Inner Circle Trader (ICT) methodology.
Wskaźnik
Prop
Forex
+11
🌊 See when the market is truly in play. Tsunami measures Relative Volume by time-of-day 🌊
Logo „Squeeze Pro Momentum”
Najwyżej oceniane
4.0
(4)
$19
/
$29
Wskaźnik
ATR
Volume
+4
This allows traders to see not just the trend, but whether the momentum itself is overextended.
Wskaźnik
Key Levels
Order Block
+2
It monitors trend lines on price charts and fires multi-channel alerts and optionally places trades when price crosses..
Wskaźnik
Forex
Crypto
+4
Spot powerful 3-candle reversal patterns like Morning/Evening Star and Soldiers/Crows at key swing highs and lows
Wskaźnik
AI
ATR
+27
Overbought Oversold Indicator
Wskaźnik
MACD
Forex
+6
Auto Signal BUY SELL is a professional decision-making tool designed to help you follow the trend and capture high-proba
Wskaźnik
Crypto
Signal
+3
Candlestick Signal Finder: cTrader indicator that automatically detects and color-codes key Japanese candlestick pattern
Wskaźnik
BOS
EMA
+5
Directional volume heatmap: see if a price zone was built on buying or selling, not just how much.
Logo „MultiTimeFrameTrend”
Najwyżej oceniane
4.0
(4)
$19
/
$30
Wskaźnik
A compact, visual multi-timeframe trend indicator for cTrader. Easily spot bullish or bearish trends across 4 customizab
Wskaźnik
Parabolic SAR Alert - Trend reversal alerts with smart signals & custom alerts.
Wskaźnik
RSI
Indicator Stochastic With RSI
Logo „MM-Symbol Info (Pro)”
Najwyżej oceniane
4.5
(4)
$19
Wskaźnik
Prop
Forex
NEW - PNLs as % - daily, weekly, monthly, or yearly & Spread, Time To Close, PNL Alerts, custom Bid / Ask lines
Wskaźnik
ATR
RSI
+24
Daily moving averages, simplified. Displays 3 daily moving averages on lower timeframes with selectable MA types.
Wskaźnik
ATR
Channel
Reversal Trap Probability Bands plots a dynamic volatility envelope around price & automatically detects "trap" reversal
Wskaźnik
Forex
Crypto
+3
Enhance Pitchfork & Price Channels in cTrader with customizable Equidistant and Fibonacci levels.
Logo „Market Structure Shift”
Najwyżej oceniane
4.2
(4)
$19
/
$35
Wskaźnik
Prop
Forex
+11
Market Structure Shift – Professional Market Structure Oscillator
Wskaźnik
Forex
Crypto
+2
Market Structure Indicator – Your Trading Map in a Noisy Market. No more Panicking Which one, Where, Why and How.

Cena

29
Sprzedaż
812
Bezpłatne instalacje





























