
Descrição
Como Operar Usando a Estratégia Donchian (Breakout)
- Comprar quando o preço ultrapassa a máxima do período N (Superior).
- Vender quando o preço ultrapassa a mínima do período N (Inferior).
- Manter a posição enquanto a tendência continuar; sair em um breakout oposto ou via trailing stop.
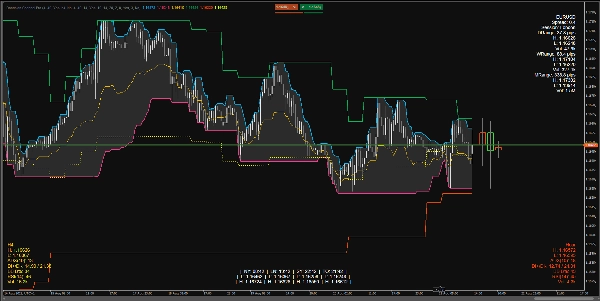
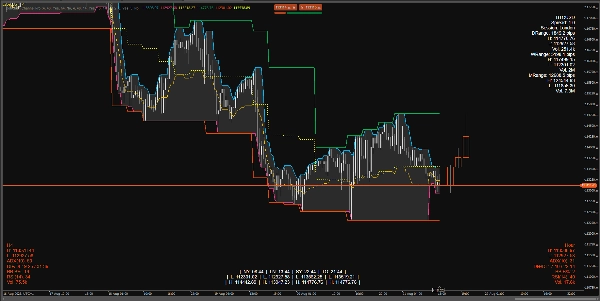
O Que o Indicador Mostra no Gráfico
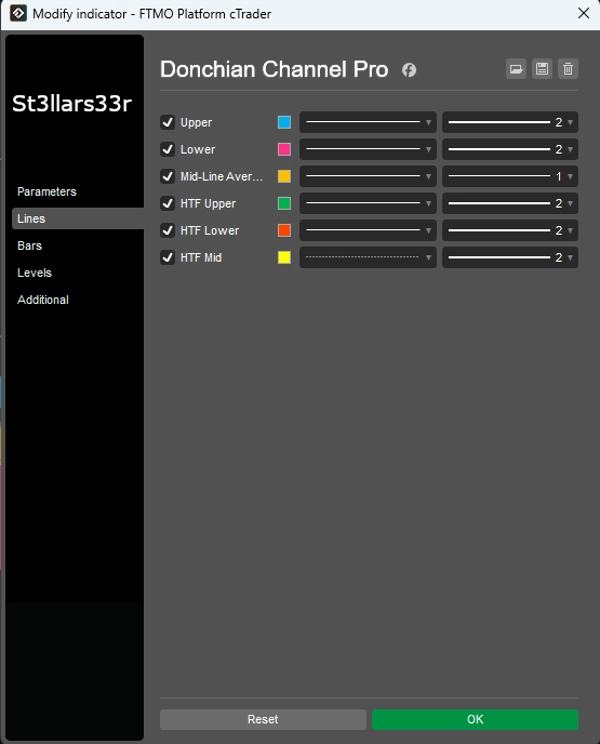
Donchian no Timeframe Atual (TF):
- Superior: O preço mais alto nas barras do Canal Superior.
- Inferior: O preço mais baixo nas barras do Canal Inferior.
- Meio: O ponto médio entre Superior e Inferior.
Sobreposição HTF: Linhas Donchian de um timeframe superior sobrepostas no gráfico:
- HTF Superior, HTF Inferior, HTF Meio
- HUD Velas HTF: Retângulos representando velas de timeframe superior, ancorados à direita da última barra no TF atual.
HUDs (Heads-Up Displays) na Parte Inferior/Superior:
- TopoDireito: Painel de informações para o símbolo + ranges diários/semanais/mensais.
- InferiorEsquerdo: HUD HTF (métricas para o timeframe superior).
- InferiorDireito: HUD Mid TF (métricas para o timeframe intermediário).
- InferiorMeio: Relógios de sessão + Máxima/Mínima para cada sessão (persistente).
O Que Cada HUD Exibe
TopoDireito (Canto Superior Direito)
- NomeSímbolo
- Spread: Spread em pips.
- Sessão: Sessão ativa atual (baseada nas horas especificadas).
- DRange/WRange/MRange: Range diário/semanal/mensal em pips.
- H/L/Vol: Máxima/Mínima e volume total para o período respectivo.
InferiorEsquerdo (Canto Inferior Esquerdo) — HUD HTF
- Nome TF (ex.: H4, D1, etc.)
- H/L: Máxima/mínima atual da última barra HTF (ou ativa).
- ADX(n), DI+/DI-: Indicadores de tendência.
- BB B%: Posição do preço atual relativo às Bandas de Bollinger no HTF (0 perto da banda inferior, 100 perto da banda superior).
- RSI(n)
- Vol: Volume no HTF.
- Cor do HUD:
-
- Verde: Range expandindo para cima (DI+ e ADX subindo).
- Vermelho: Pressão descendente crescente (DI- subindo).
- Amarelo: Neutro/indefinido.
InferiorDireito (Canto Inferior Direito) — HUD Mid TF
- Mesmo que o HUD HTF, mas para o timeframe intermediário (Mid Timeframe).
InferiorMeio (Centro Inferior) — Relógios + Máxima/Mínima da Sessão
- Hora em NY, LN, SY, TO.
- Mín/Máx para cada sessão.
- Lógica Persistente: Quando uma sessão está inativa, mostra a Máxima/Mínima da última sessão concluída; quando uma nova sessão começa, os valores são resetados e recalculados.
Parâmetros e Como Usá-los
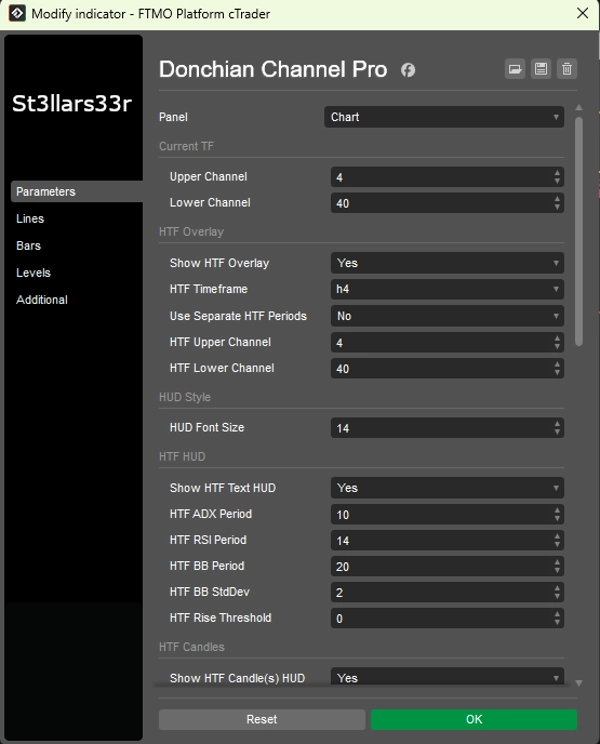
Grupo: TF Atual (Donchian Atual)
- Canal Superior: Número de barras para o canal superior. Valor maior = atualizações menos frequentes, linha mais plana.
- Canal Inferior: Número de barras para o canal inferior.
Grupo: Sobreposição HTF (Sobreposição Donchian de Timeframe Superior)
- Mostrar Sobreposição HTF: Habilita linhas HTF no gráfico.
- Timeframe HTF: Selecionar timeframe superior (ex.: Hour4).
- Usar Períodos HTF Separados: Se verdadeiro, HTF Superior/Inferior usam seus próprios parâmetros; se falso, usa Superior/Inferior atuais.
- Canal Superior HTF: Comprimento do canal superior para HTF.
- Canal Inferior HTF: Comprimento do canal inferior para HTF.
Grupo: Estilo HUD
- Tamanho da Fonte do HUD: Tamanho da fonte para todos os HUDs (TopoDireito, InferiorEsquerdo, InferiorDireito, InferiorMeio).
Grupo: HUD HTF (Inferior Esquerdo)
- Mostrar HUD de Texto HTF: Exibir HUD de texto para HTF.
- Período ADX HTF: Período ADX/DI. Maior = mais suave, menos ruído, mas resposta mais lenta.
- Período RSI HTF: Período RSI.
- Período BB HTF: Período das Bandas de Bollinger.
- Desvio Padrão BB HTF: Multiplicador do desvio padrão para BB (clássico é 2.0).
- Limite de Subida HTF: Sensibilidade para métricas ascendentes (afeta a cor do HUD).
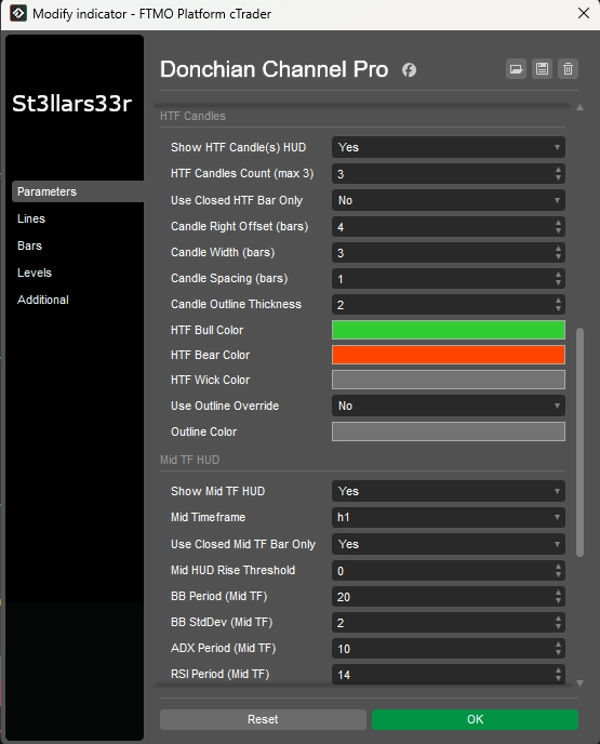
Grupo: Velas HTF (Direita, Perto da Última Barra)
- Mostrar HUD de Velas HTF: Exibir velas HTF à direita.
- Contagem de Velas HTF (máx 3): Número de velas HTF (1–3).
- Usar Apenas Barra HTF Fechada: Se verdadeiro, usa apenas velas HTF fechadas (valores estáveis). Se falso, inclui a vela aberta atual.
- Deslocamento Direito da Vela (barras): Deslocamento para a direita em barras do TF atual a partir da última barra (âncora).
- Largura da Vela (barras): Largura do retângulo da vela em barras do TF atual.
- Espaçamento entre Velas (barras): Espaço entre as velas.
- Espessura do Contorno da Vela: Espessura dos contornos das velas.
- Cor Bull HTF / Cor Bear HTF: Cores para velas de alta/baixa.
- Cor do Pavio HTF: Cor para os pavios.
- Usar Substituição de Contorno: Se verdadeiro, o corpo da vela é desenhado com um contorno (Cor do Contorno) sem preenchimento bull/bear.
- Cor do Contorno: Cor para o contorno quando Usar Substituição de Contorno = verdadeiro.
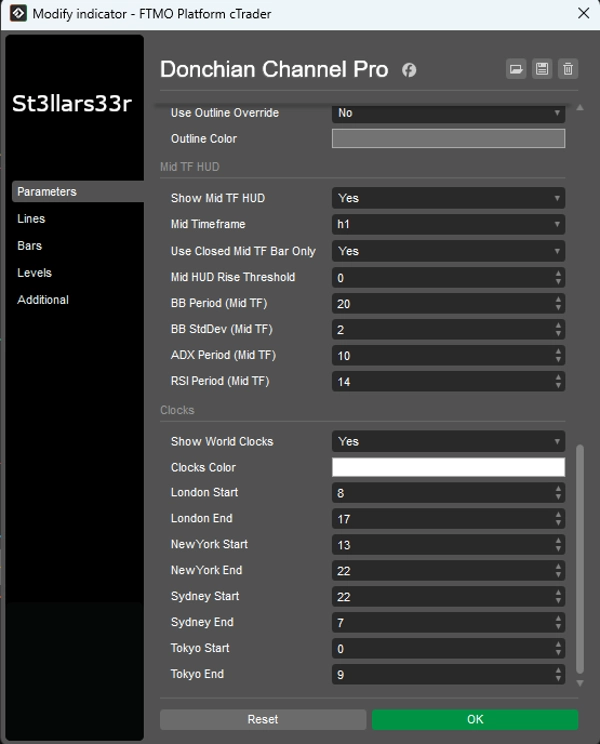
Grupo: HUD Mid TF (Inferior Direito)
- Mostrar HUD Mid TF: Habilita HUD para o TF intermediário.
- Mid Timeframe: Selecionar TF intermediário (ex.: Minute15).
- Usar Apenas Barra Mid TF Fechada: Igual ao HTF, mas para Mid TF.
- Limite de Subida do HUD Mid: Sensibilidade de cor para o HUD Mid TF.
- Período BB (Mid TF), Desvio Padrão BB (Mid TF): Configurações das Bandas de Bollinger para Mid TF.
- Período ADX (Mid TF), Período RSI (Mid TF): Períodos ADX e RSI para Mid TF.
Grupo: Relógios (Centro Inferior)
- Mostrar Relógios Mundiais: Exibir bloco com relógios e Máxima/Mínima da sessão.
- Cor dos Relógios: Cor do texto para relógios/sessões.
- Início Londres / Fim Londres: Horas de início/fim para a sessão de Londres.
- Início Nova York / Fim Nova York: Para Nova York.
- Início Sydney / Fim Sydney: Para Sydney.
- Início Tóquio / Fim Tóquio: Para Tóquio.
Relógios: Mostrar hora local real para cidades (via fusos horários do SO com compensação de fallback).
- Cálculos de atividade da sessão (e Máxima/Mínima) usam o horário do servidor do corretor (Server.Time). Se o servidor não estiver em UTC, as horas da sessão podem deslocar—ajuste Início/Fim conforme necessário para seu servidor.
- Se uma sessão atravessa a meia-noite (Fim < Início), o indicador automaticamente considera a transição de data.
- Quando uma sessão está inativa, mostra a Máxima/Mínima da última sessão concluída; quando uma nova sessão começa, os dados são resetados e recalculados.
Resumo
Avaliações de clientes
5 | 50 % | |
4 | 50 % | |
3 | 0 % | |
2 | 0 % | |
1 | 0 % |


