Descrizione
📈 Trend Master Pro MultiMA – Lo Strumento Definitivo per il Rilevamento delle Tendenze 🚀
Questo indicatore traccia 20 medie mobili con periodi diversi (5, 10, 15, 20, 25, 30, 35, 40, 45, 50, 55, 60, 65, 70, 75, 80, 85, 90, 95 e 100). Per ciascuna:
1️⃣ 📊 Seleziona il Tipo di Calcolo: Scegli tra SMA, EMA, RMA, WMA o VWMA in base alle tue preferenze. Facoltativamente, puoi abilitare la smussatura tramite regressione lineare per ridurre il rumore e ottenere una tendenza più chiara.
2️⃣ 📏 Definisci il Canale di Riferimento: Un canale basato sull’intervallo di prezzo viene calcolato utilizzando le ultime 200 candele. La larghezza del canale è regolabile, espandendosi con una maggiore volatilità dei prezzi e contraendosi in mercati più calmi.
3️⃣ 📈 Confronta le Medie Mobili con il Canale: Ogni media mobile viene analizzata in relazione all’altezza del canale e ai propri massimi e minimi su un periodo definito (predefinito: 20 candele).
- 📊 Se la differenza tra il valore massimo e minimo della media mobile supera la larghezza del canale, segnala una forte tendenza (rialzista o ribassista).
- ⚖️ Se la differenza è entro o vicino al canale, il mercato è considerato neutrale o laterale.
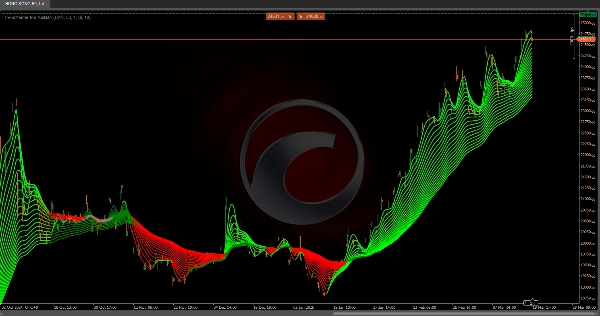
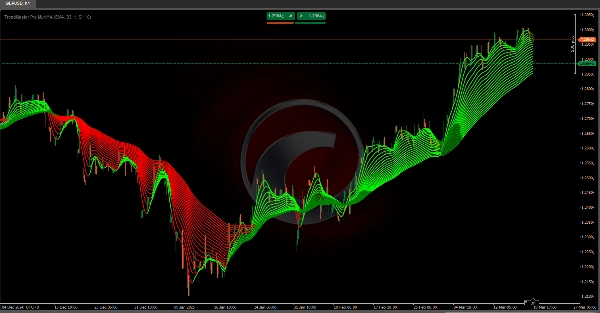
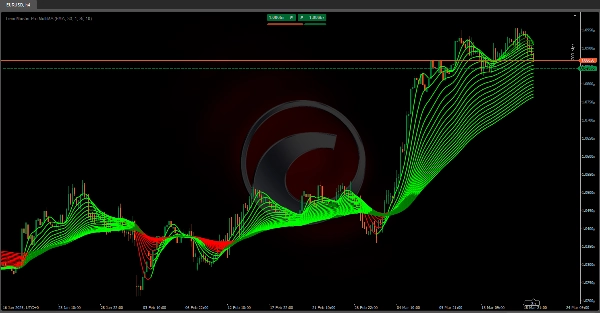
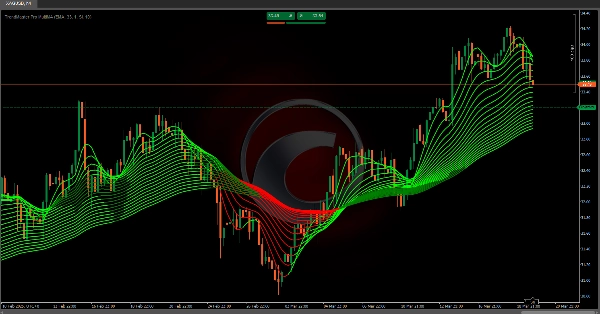
4️⃣ 🎨 Sistema di Colorazione Basato sulla Tendenza: Ogni segmento delle medie mobili è colorato in base alla forza e alla direzione della tendenza:
- 🟢 Verde = Tendenza rialzista rilevata
- 🔴 Rosso = Tendenza ribassista rilevata
5️⃣ 📉 Visualizzazione della Tendenza: L’indicatore collega ogni valore della media mobile da una candela all’altra, formando una struttura a ventaglio di linee di tendenza. Ogni media mobile adatta dinamicamente il proprio colore in base alla tendenza calcolata.
✅ Perché Usare Trend Master Pro MultiMA?
Questo approccio adattivo multi-timeframe—che combina più medie mobili, canali di prezzo e smussatura tramite regressione—aiuta a identificare rapidamente le fasi di mercato:
🔹 Tendenze rialziste ✅
🔹 Tendenze ribassiste ❌
🔹 Movimenti laterali/di range 🔄
🚀 Perfetto per i trader che cercano chiare intuizioni visive per prendere decisioni migliori in timeframe a breve, medio e lungo termine! 📊🔥
Indicatori del Ctrader Store:
Dynamic Market Structure
Analisi dei Punti di Inversione
Fibonacci Linear
Regression Multi-timeframe
Multi-Level Candle Bias
Tracker
Auto Support and
Resistance Trend Lines
Riepilogo
Each moving average is compared against this channel and its own highs and lows over a defined period (default 20 candles). If the range of a moving average exceeds the channel width, it signals a strong bullish or bearish trend; if within or near the channel, the market is considered neutral or ranging. The indicator visually represents trends by connecting moving average values candle-to-candle, forming a fan-like structure of trendlines. Trend strength and direction are indicated by color coding: green for bullish and red for bearish trends.
This multi-timeframe adaptive tool integrates multiple moving averages, price channels, and regression smoothing to help traders quickly identify market phases—bullish, bearish, or ranging—across short, medium, and long-term timeframes.
Recensioni dei clienti
5 | 100 % | |
4 | 0 % | |
3 | 0 % | |
2 | 0 % | |
1 | 0 % |