
Repiptor BB Colored Width
Indicatore
156 download
Versione 1.0, Oct 2024
Windows, Mac
5.0
Recensioni: 1
Descrizione
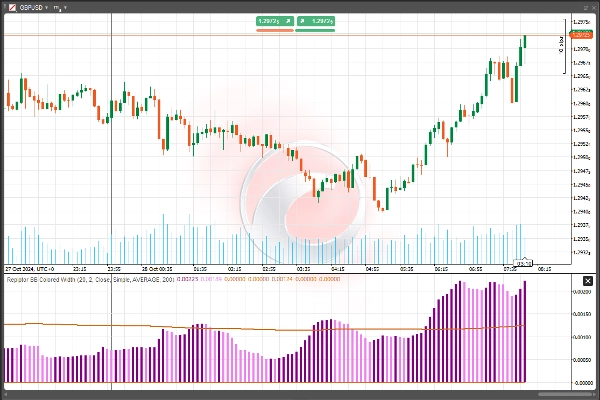
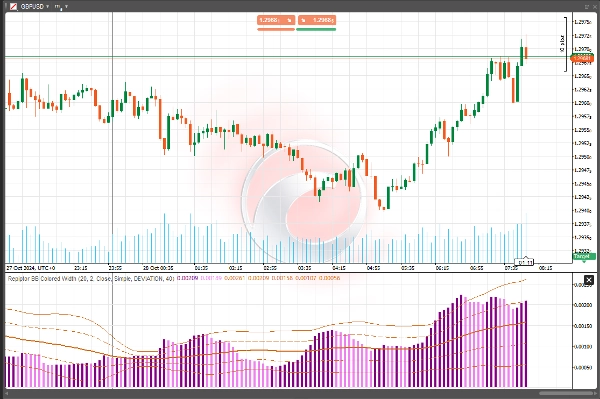
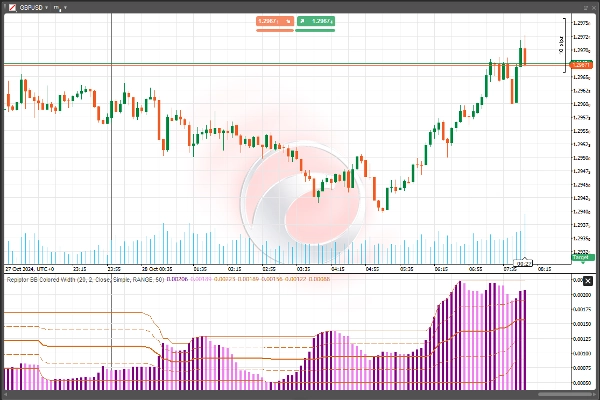
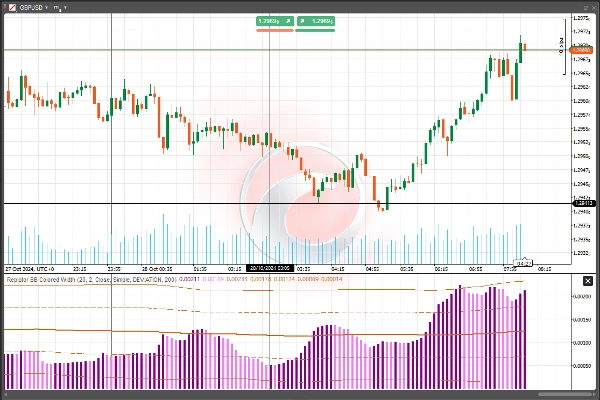
Larghezza delle Bande di Bollinger colorate con quattro livelli dinamici alternativi:
- Media
- Mediana
- Deviazione
- Intervallo
Colore più scuro = volatilità in aumento, Colore più chiaro = volatilità in diminuzione
Riepilogo
Riepilogo AI
Repiptor BB Colored Width is a technical indicator that visualizes the width of Bollinger Bands with color coding to represent volatility changes. It offers four dynamic measurement levels for the Bollinger Bands width: Average, Median, Deviation, and Range. The indicator uses color intensity to indicate volatility trends—darker colors signify increasing volatility, while lighter colors indicate decreasing volatility. This tool helps traders assess market volatility visually by highlighting changes in the Bollinger Bands width on their charts.
Profilo indicatore
Recensioni dei clienti
5.0
Recensioni: 1
5 | 100 % | |
4 | 0 % | |
3 | 0 % | |
2 | 0 % | |
1 | 0 % |
Recensioni dei clienti
August 18, 2025
Clear volatility visualization, customizable, lightweight. Cons: No alerts, no MTF mode, lacks integrated breakout signals.
Discussioni
Domande frequenti
Bollinger
I prodotti disponibili tramite cTrader Store, inclusi bot di trading, indicatori e plugin, sono forniti da sviluppatori terzi e resi disponibili esclusivamente a scopo informativo e di accesso tecnico. cTrader Store non è un broker e non fornisce consulenze in materia di investimento, raccomandazioni individualizzate o garanzie di risultati futuri.
Altro da questo autore


Prezzo
Da 26/10/2024
1.19K
Installazioni gratuite