
Açıklama
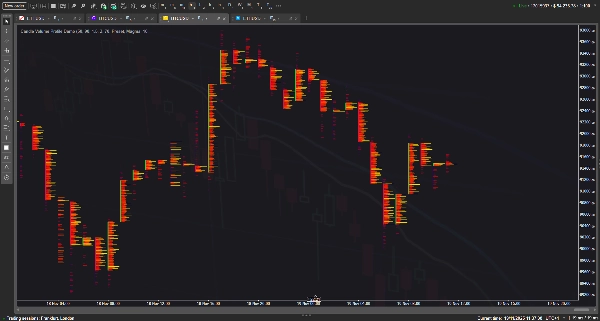
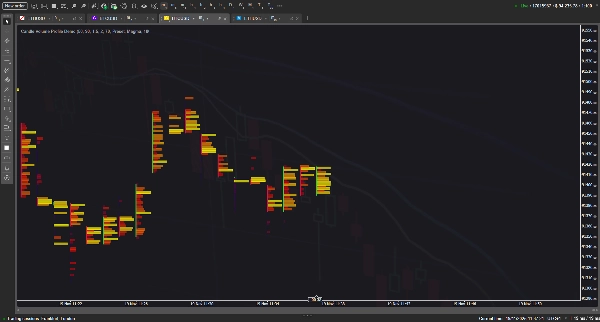
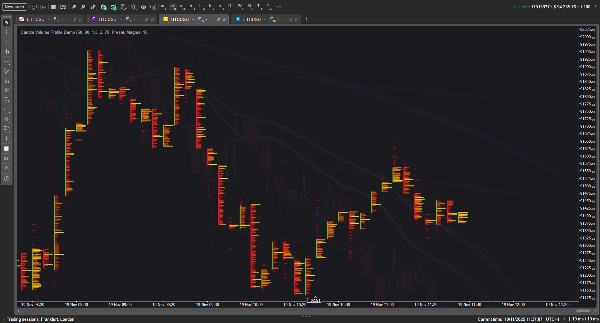
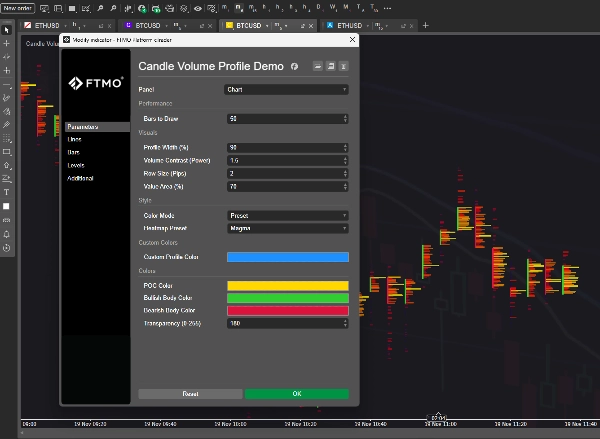
Bu gösterge, bireysel çubuklar için Hacim Profili'ni görselleştirir ve standart mum çubuklarını, özelleştirilebilir ısı haritaları, Kontrol Noktası (POC) çizgileri ve fiyat seviyesine göre hacim dağılımını vurgulamak için Değer Alanı blokları içeren ayrıntılı bir 'ayak izi' tarzı grafik haline dönüştürür. Piyasa aktivitesini doğrudan grafikte göstermek için sezgisel hacim dağılımı kullanarak profesyonel emir akışı araçlarını taklit etmeyi amaçlar.
Teorik olarak, bu konsept derin piyasa içgörüleri sağlamak için sorunsuz çalışmalıdır; ancak pratikte, render için gereken muazzam sayıda grafik nesnesi nedeniyle, bu göstergeden ne kadar çok özellik ve geçmiş derinliği talep ederseniz, o kadar gecikme yaşar ve terminal kararsızlığına neden olur. :(
Özet
Müşteri değerlendirmeleri
5 | 0 % | |
4 | 100 % | |
3 | 0 % | |
2 | 0 % | |
1 | 0 % |


!["[Stellar Strategies] Linear Regression Candles 1.1" logosu](https://cdn.ctrader.com/image/webp/8b9cff9f-2431-46d2-b0ec-c7f55f4a4a6d_27918)


