
Market Entropy
Gösterge
107 i̇ndirmeler
Sürüm 1.0, Aug 2025
Windows, Mac
Başlangıç 26/05/2025
388.58M
İşlem hacmi
60.75K
Kazanılan pip
15
Satışlar
1.41K
Ücretsiz yüklemeler
Açıklama
Piyasa Entropisi, piyasa organizasyonunu ölçen ve Düzen → Geçiş → Kaos boyunca rejim değişikliklerini işaret eden çift göstergeli (osilatör + isteğe bağlı fiyat örtüsü) bir göstergedir. Trendlik (DC) adında ikinci bir çizgi ekler, gerçek trendi volatilite sıkışmasından ayırmak için.
Nasıl çalışır:
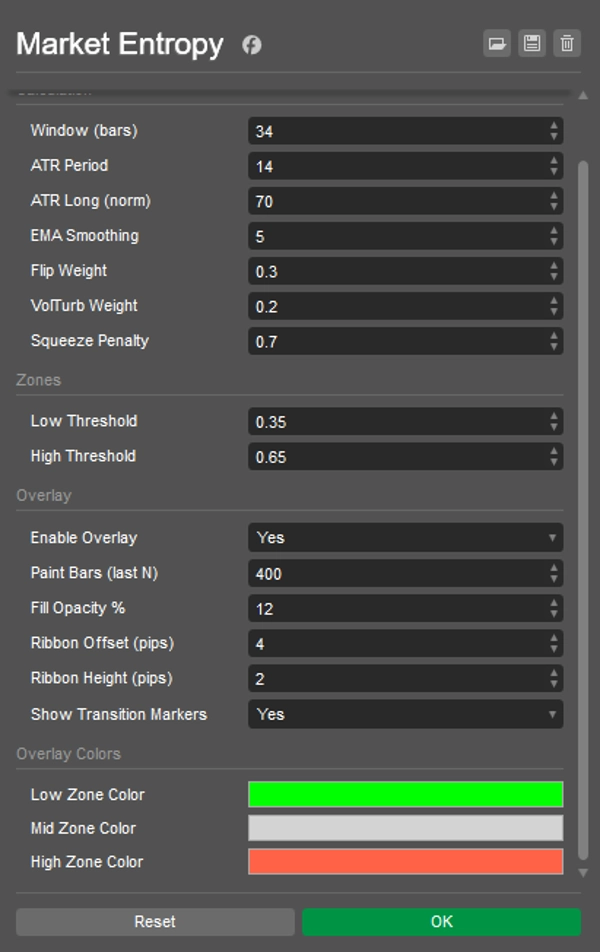
- Yalnızca OHLCV bileşenlerini kullanır: DC (yön tutarlılığı), FlipRate (işaret değişimleri), Volatility_n (ATR/ATRlong), VolumeTurb (ΔHacim'in standart sapması).
- Ham entropi:
E0 = 0.5*(1-DC) + 0.3*(FlipRate*VolN) + 0.2*VolumeTurb). - Anti-sıkışma terimi, ATR sıkışmaları sırasında E değerini düşürür → EMA yumuşatması ile nihai Entropi ∈ [0..1].
- İşaretçiler:
-
- KRİSTAL — LowThr'nin altına geçiş (düzen ortaya çıkar: trend veya kırılma öncesi sıkışma).
- ÇÖZÜLME — HighThr'nin üzerine geçiş (düzen bozulur: kaos/trend zayıflaması).
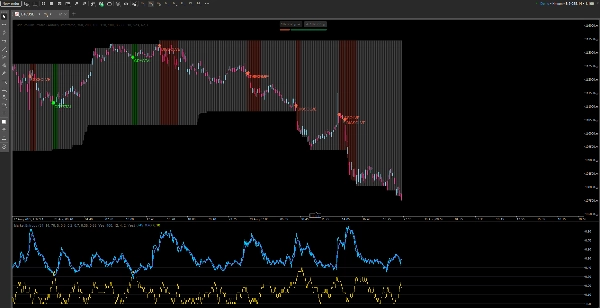
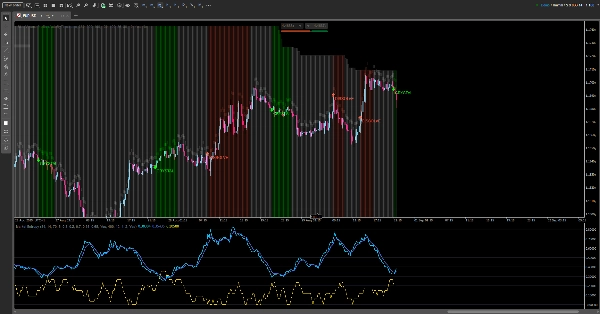
Gördükleriniz:
- Panelde: Entropi, Entropi(EMA), Trendlik (DC), Düşük/Yüksek eşikler, bölge arka planı.
- Grafikte (açılıp kapatılabilir): durum renkli çubuklar, yükseklerin üzerinde ince bir şerit ve KRİSTAL/ÇÖZÜLME işaretçileri.
Okuma rehberi:
- E < LowThr → Düzen:
-
- yüksek DC ile → organize trend;
- düşük ATR ile → sıkışma (kırılma beklenir).
- LowThr…HighThr → Geçiş: yapı oluşuyor; çözüm bekleyin.
- E > HighThr → Kaos: belirsizlik / trendin zayıflaması; saf devam girişlerinden kaçının.
Oyun planları:
- Sıkışma → KRİSTAL → Kırılma/Yeniden Test — kırılmayı işlem yapın.
- Trend → ÇÖZÜLME — pozisyonu azaltın veya riski sıkılaştırın.
Özet
Gösterge profili
Müşteri değerlendirmeleri
0.0
Değerlendirmeler: 0
Müşteri değerlendirmeleri
Bu ürün için henüz bir değerlendirme yok. Ürünü denediniz mi? O zaman ona dair görüşlerini paylaşan ilk kişi olun!
Tartışma
SSS
cTrader Store üzerinden erişilebilen işlem botları, göstergeler ve eklentiler gibi ürünler, üçüncü taraf sağlayıcılar tarafından sağlanır ve yalnızca bilgilendirme ve teknik erişim amaçlarıyla sunulur. cTrader Store bir broker değildir ve yatırım tavsiyesi, kişisel öneriler vermez veya gelecekteki performansı garanti etmez.


Fiyat
Başlangıç 26/05/2025
388.58M
İşlem hacmi
60.75K
Kazanılan pip
15
Satışlar
1.41K
Ücretsiz yüklemeler