Açıklama
🔷 Trend Lines Premium Motoru
Çok Katmanlı Piyasa Yapısı & Dinamik Regresyon Göstergesi
https://chartshots.spotware.com/c/69d3c949a2e08
📌 Nedir?
Trend Lines Premium Motoru beş bağımsız modülü tek bir araçta birleştiren bir üst gösterge. Her modül açılıp kapatılabilir. Piyasa yapısını, dinamik kanalları ve hacme dayalı regresyon bölgelerini doğrudan fiyat grafiği üzerinde haritalar.
Üç temel soruya cevap verir:
- Fiyat mevcut yapı içinde nerede?
- Hakim trend nedir ve kırılma noktaları nerede?
- Hangi fiyat seviyelerinde aktivite yoğunlaşmıştır?
🧩 5 Modül
1️⃣ Swing Aralığı Bağlayıcı
https://chartshots.spotware.com/c/69d3cab9b805b
En son swing yükseklerini ve düşüklerini tespit eder, ardından her iki tarafta en eski ile en yeniyi bağlayan eğimli bir kanal çizer. Aradaki alan dinamik bir aralık bölgesi olarak doldurulur.
Nasıl çalışır:
- Bir bar, yüksek (veya düşük) değeri kendisinden önceki ve sonraki N bar ile karşılaştırıldığında en uç değer olduğunda swing noktası olarak kabul edilir.
- En eski kaydedilen swingi en yenisine bağlayan düz bir çizgi çizilir ve üst ve alt sınırlar oluşturulur.
- Her yeni swing noktası onaylandığında kanal otomatik olarak kayar.
Nasıl okunur:
- Kanal içindeki fiyat → tanımlı yapısal aralık.
- Üstünde/altında kırılma → volatilite genişlemesi veya yapı değişimi.
- Kanal eğimi → baskın aralık yönü.
Parametre
Amaç
Swing Öncesi / Sonrası Barlar
Bir swing'i onaylamak için her iki tarafta gereken bar sayısı. Daha yüksek = daha anlamlı swingler
Maksimum Swing Noktası
Kaç swing saklanacağı. Kanal derinliğini kontrol eder
Geçmiş Penceresi
Kanalın ne kadar geriye çizileceği
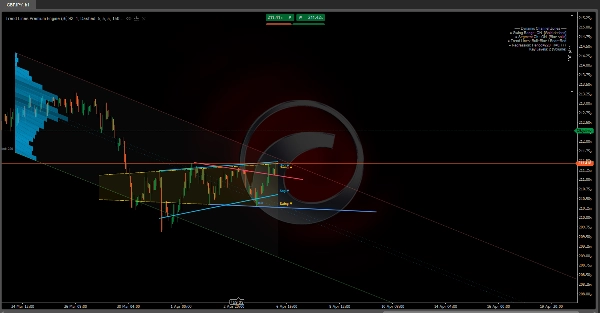
2️⃣ Segment Doğrusal Kanal
https://chartshots.spotware.com/c/69d3cb221bba1
Analiz penceresini 5 eşit segmente böler, her segmentte en yüksek yüksek ve en düşük düşük değerleri bulur, ardından bu 5 üst nokta için ve 5 alt nokta için en küçük kareler regresyon çizgisi uygular.
Nasıl çalışır:
- Pencere 5 parçaya bölünür. Her parça için bir temsilci uç değer çıkarılır.
- Her sınır için bu 5 nokta üzerinde doğrusal regresyon uygulanır.
- Sonuç, sadece iki uç nokta yerine segmentli fiyat yapısına uyum sağlayan bir kanaldır.
Nasıl okunur:
- Yükselen kanal → yapısal yükseliş trendi.
- Alçalan kanal → yapısal düşüş trendi.
- Bir sınırda tekrar eden temaslar → dinamik destek/direnç.
Modül 1’den farkı: Swing Aralığı sadece ilk ve son swingi bağlarken, Segment Kanal 5 noktalı regresyon kullanır, bu da onu daha yumuşak ve tek bir swinge karşı daha az tepki veren yapar.
3️⃣ Swing Noktası Etiketleri
Swing yükseklerini ve düşüklerini tespit eder ve bunları 4 piyasa yapı kategorisine sınıflandırır:
Etiket
Anlamı
Gösterir
HL
Yüksek Düşük
Boğa yapısı
HH
Yüksek Yüksek
Boğa yapısı
LH
Düşük Yüksek
Ayı yapısı
LL
Düşük Düşük
Ayı yapısı
Nasıl çalışır:
- Her yeni swing düşük, önceki swing düşük ile karşılaştırılır. Daha yüksek → HL. Daha düşük → LL.
- Her yeni swing yüksek, önceki swing yüksek ile karşılaştırılır. Daha yüksek → HH. Daha düşük → LH.
Nasıl okunur:
- HL + HH sekansı → yükseliş trendi devam ediyor.
- LH + LL sekansı → düşüş trendi devam ediyor.
- Bir HL'nin LL'ye veya bir LH'nin HH'ye kırılması → yapı değişimi (BOS/CHoCH).
Varsayılan olarak, grafik temiz kalması için sadece HL ve LH gösterilir. Tam yapı görünürlüğü için HH ve LL etkinleştirilebilir.
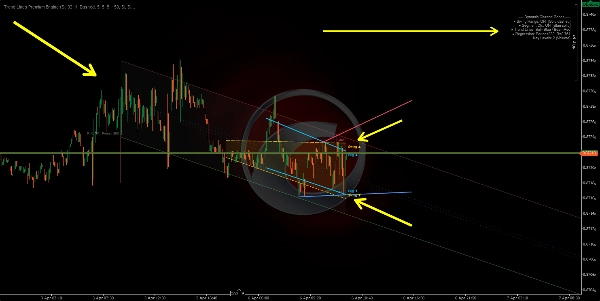
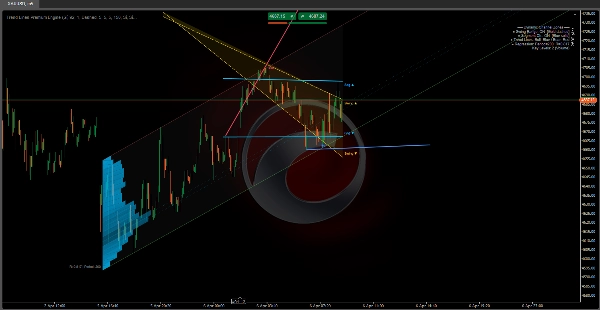
4️⃣ Otomatik Trend Çizgileri
https://chartshots.spotware.com/c/69d3cc071272e
En son iki swing düşük (boğa çizgisi) ve en son iki swing yüksek (ayı çizgisi) bağlayan trend çizgileri çizer. Aktif çizgi belirgindir; önceki çizgiler soluklaşır.
Nasıl çalışır:
- Yeni swing düşük tespit edildiğinde → önceki swing düşükten yeni swing düşüğe çizgi çizilir (boğa trend çizgisi).
- Yeni swing yüksek tespit edildiğinde → önceki swing yüksekten yeni swing yükseğe çizgi çizilir (ayı trend çizgisi).
- Çizgi, yapılandırılabilir bir bar sayısı kadar ileri projekte edilir.
- Yeni bir çizgi oluşturulduğunda, önceki çizgi yarı saydam bir renge soluklaşır.
Kırılma sinyalleri (isteğe bağlı): Etkinleştirildiğinde, gösterge kapanış fiyatının aktif trend çizgisini kesip kesmediğini tespit eder:
- 🔼 Yukarı ok → boğa kırılması.
- 🔽 Aşağı ok → ayı kırılması.
Parametre
Amaç
Maksimum Çizgi Çifti
Görünür tutulan çizgi çiftlerinin sayısı. En temiz görünüm için 1 olarak ayarlanır
Maksimum Uzatma Barları
Çizginin ne kadar ileri projekte edileceği. Çizgilerin tüm grafiği çaprazlamasını önler
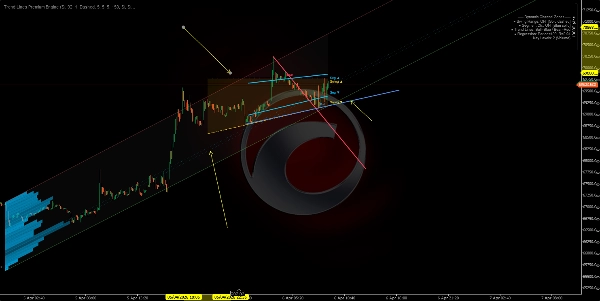
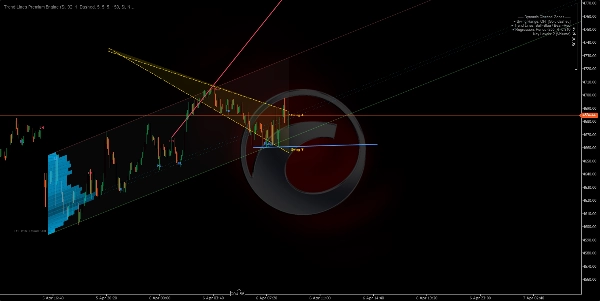
5️⃣ Dinamik Regresyon Bölgesi
En gelişmiş modül. Kapanış fiyatları üzerinde doğrusal regresyon kanalı hesaplar ve kanalda hacim veya temasların yoğunlaştığı yerleri gösteren aktivite profili (histogram) bindirir. Ayrıca en yüksek aktivite bölgelerinde ana seviyeleri işaretler.
A) Regresyon Kanalı:
- Verilen bir dönem boyunca kapanış fiyatlarına en küçük kareler doğrusal regresyon uygulanır.
- Fiyatların regresyon çizgisinden sapmasının standart sapması hesaplanır.
- Üst ve alt bantlar merkezden N standart sapma uzaklıkta yerleştirilir (varsayılan: 2.0).
- İsteğe bağlı olarak yüksek fiyatlı veya yüksek volatilite enstrümanlarda daha iyi doğruluk için logaritmik ölçekte hesaplanır.
B) Otomatik Dönem Tespiti:
- Algoritma, 50 ila 400 bar arasında birden fazla dönem test eder ve her biri için Pearson korelasyon katsayısını hesaplar.
- Doğrusal regresyonun fiyat hareketine en iyi uyduğu en yüksek korelasyona sahip dönemi seçer.
- Korelasyon değeri grafikte gösterilir (örneğin, R = 0.85).
C) Aktivite Histogramı:
- Kanal yatay bölümlere ayrılır (en fazla 25).
- Her bölüm için algoritma, o fiyat seviyesine kaç barın dokunduğunu sayar, bunu hacim veya temas sayısı (ayarlanabilir) ile ağırlıklandırır.
- Daha yüksek aktivite bölümleri daha uzun ve daha opak çubuklar olarak görünür.
- Bu, kanal içindeki Kontrol Noktası (POC) ve yüksek/düşük aktivite bölgelerini ortaya çıkarır.
D) Ana Seviyeler:
- En yüksek aktiviteye sahip bölümler ileriye doğru yatay çizgiler olarak projekte edilir.
- Bunlar regresyon bağlamında hacme dayalı destek ve direnç olarak işlev görür.
Nasıl okunur:
- Fiyat üst banda yakınsa → istatistiksel olarak aşırı alım bölgesi.
- Fiyat alt banda yakınsa → istatistiksel olarak aşırı satım bölgesi.
- R 1 veya -1’e yakınsa → güçlü, güvenilir doğrusal trend. R 0’a yakınsa → yatay seyir veya regresyon anlamlı değil.
- Ana seviyeler fiyat mıknatısı gibi davranır — tarihsel aktivite yoğunluğu olan bölgeler fiyatı geri çekmeye eğilimlidir.
🎯 Kullanım Alanları
Kullanım Alanı
Modüller
Piyasa yapısını tanımla (boğa/ayı/aralık)
Swing Etiketleri + Trend Çizgileri
Dinamik destek ve direnç tespit et
Swing Aralığı + Segment Kanal
Hacme göre değer bölgelerini bul
Regresyon Bölgesi + Ana Seviyeler
Yapı kırılmalarını onayla
Trend Çizgileri + Kırılma Sinyalleri
Trend gücünü ölç
Pearson Korelasyonu (Regresyon Bölgesi)
⚙️ Tarza Göre Önerilen Kurulum
Tarz
Önerilen Modüller
Scalping (M1–M15)
Swing Etiketleri + Trend Çizgileri
Gün içi (M15–H1)
Tüm modüller
Swing Trading (H4–D1)
Swing Aralığı + Regresyon Bölgesi + Ana Seviyeler
Saf yapı analizi
Sadece Swing Etiketleri + Trend Çizgileri
⚠️ Önemli Notlar
Özet
The five modules include:
1. Swing Range Connector: Detects recent swing highs and lows to draw a sloped channel representing the structural range.
2. Segment Linear Channel: Divides the analysis window into five segments, fitting regression lines through highs and lows for a smoother channel.
3. Swing Point Labels: Classifies swing highs and lows into four market structure categories (Higher High, Higher Low, Lower High, Lower Low) to indicate bullish or bearish trends and structure shifts.
4. Automatic Trend Lines: Connects the two most recent swing highs and lows with trend lines, highlighting active lines and optionally signaling breakouts.
5. Dynamic Regression Zone: Calculates a linear regression channel on closing prices with an activity histogram showing volume or touch concentration, marking key volume-based support and resistance levels.
The indicator supports various trading styles, recommending specific module combinations for scalping, intraday, swing trading, and pure structure analysis. It requires price bars and volume data and provides visualizations and signals including breakout, trend strength, and level touches or breaks.