
Açıklama
WinSMC Kullanıcı Kılavuzu
1. Amaç
`WinSMC`, cTrader için bir üst üste binen SMC göstergesidir. Size görsel olarak yardımcı olur:
- Piyasa yapısı değişimleri
- `BOS` (Yapı Kırılması)
- `MSS` (Piyasa Yapısı Değişimi)
- `Order Blocks`
- `Likidite Kapmaları` / `Süpürmeler`
- `FVG` (Adil Değer Boşlukları)
Otomatik bir işlem sistemi değildir. Onay temelli işlemler için en iyi şekilde kullanılan bir yapı ve bağlam aracıdır.
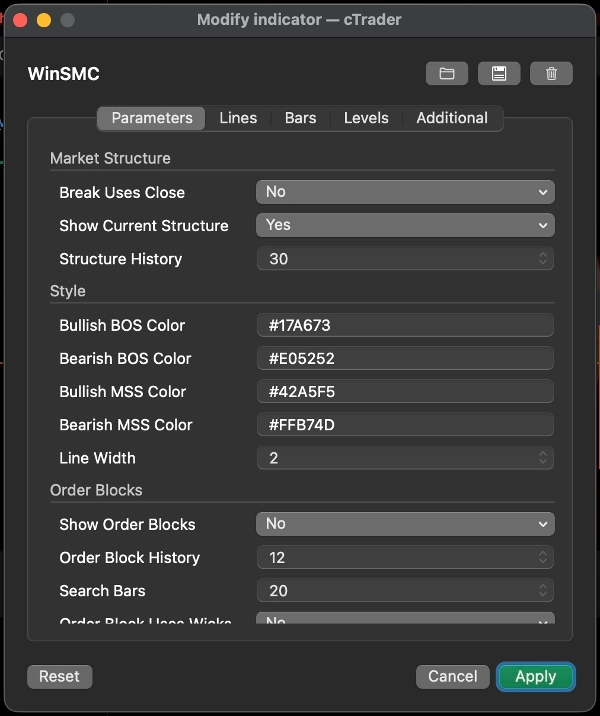
2. Temel Kavramlar
Salınım Uzunluğu
`Salınım Uzunluğu`, bir pivotun geçerli bir salınım noktası olarak kabul edilmeden önce ne kadar sola ve sağa doğrulanması gerektiğini kontrol eder.
Pratik rehberlik:
- Daha küçük değerler = daha fazla sinyal, daha fazla gürültü
- Daha büyük değerler = daha az sinyal, daha temiz yapı
Kırılma Kapanışı Kullanır
Bu ayar, bir yapı kırılmasının şu şekilde onaylanıp onaylanmayacağını belirler:
- `Evet`: mum kapanışı
- `Hayır`: fitil/düşük/yüksek kırılması
Rehberlik:
- Daha muhafazakar bir yaklaşım için kapanışı kullanın
- Daha erken ve hassas tespit için fitil kırılmalarını kullanın
Mevcut Yapıyı Göster
Mevcut aktif salınım yüksek ve salınım düşük çizgilerini gösterir, piyasanın hala neyi dikkate aldığını görmenize yardımcı olur.
Yapı Geçmişi
Grafikte kaç tane yapı kırılma çizgisi ve etiketi tutulacağını kontrol eder.
3. BOS ve MSS
BOS
`BOS`, fiyatın aynı yönde devam ettiğini ve önceki yüksek veya düşük seviyeyi kırdığını ifade eder.
Tipik yorum:
- Yükselen trendde, önceki yüksek seviyenin kırılması yükseliş BOS'dur
- Düşen trendde, önceki düşük seviyenin kırılması düşüş BOS'dur
MSS
`MSS`, piyasanın önceki eğiliminden yön değiştirdiğini ifade eder.
Tipik yorum:
- Fiyat düşüşteyken önceki yüksek seviyeyi kırarsa, bu yükseliş MSS'dir
- Fiyat yükselişteyken önceki düşük seviyeyi kırarsa, bu düşüş MSS'dir
İşlem kullanımı
- `BOS` daha çok trend devamına yöneliktir
- `MSS` daha çok dönüşe yöneliktir
- En iyi girişler genellikle bir `Order Block` veya `FVG` retestinden gelir
4. Order Blocks
Bir `Order Block`, yapı kırılmasından önceki son zıt mumdur. Genellikle arz/talep reaksiyon bölgesi olarak kabul edilir.
Order Blockları Göster
Etkinleştirildiğinde, gösterge bir `BOS` veya `MSS` sonrası geriye bakar ve son zıt mum bölgesini çizer.
Anlamı
- Boğa OB: yükseliş kırılmasından sonra son düşüş mumudur
- Ayı OB: düşüş kırılmasından sonra son yükseliş mumudur
Fiyat bölgeyle etkileşime girmeye başladığında, bu azaltılmış olarak işaretlenir.
Order Block Fitil Kullanımı
Kutunun ne kadar geniş çizileceğini kontrol eder:
- `Evet`: tam mum aralığını kullanır, daha geniş bölge
- `Hayır`: daha sıkı bir çekirdek bölge kullanır
Rehberlik:
- Daha geniş ve daha muhafazakar bir bölge için `Evet` kullanın
- Daha dar ve daha hassas bir bölge için `Hayır` kullanın
Order Block stratejisi
Yaygın iş akışı:
1. `BOS` veya `MSS` bekleyin
2. İlgili OB'yi işaretleyin
3. Retest için bekleyin
4. Girmeden önce onay arayın
OB'yi garantili bir dönüş noktası olarak değerlendirmeyin. Bu yüksek ilgi alanıdır, kesinlik değildir.
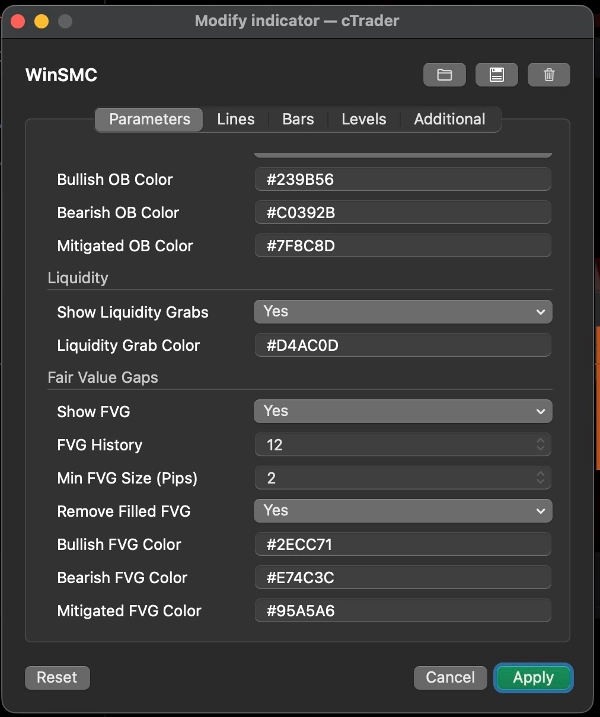
5. Likidite Kapmaları / Süpürmeler
Bir `Likidite Kapma`, fiyatın önceki bir yüksek seviyenin üzerine veya önceki bir düşük seviyenin altına koşup sonra tekrar içine kapanmasıdır.
Bu göstergede:
- `Alım tarafı süpürme`: fiyat önceki yüksek seviyeyi alır ve tekrar altına kapanır
- `Satım tarafı süpürme`: fiyat önceki düşük seviyeyi alır ve tekrar üstüne kapanır
Bu genellikle piyasanın likiditeyi kaptığını ve bir sonraki hamleye hazırlanıyor olabileceğini gösterir.
Önemli
Bir süpürme tek başına işlem sinyali değildir.
Daha çok şöyle değerlendirilmelidir:
- Likiditenin alındığına dair bir uyarı
- Bir kurulum ipucu
- `MSS` veya `BOS` için bekleme nedeni
Yaygın kullanım
- Bir `Alım tarafı süpürme` sonrası, düşüş `MSS` kısa pozisyon kurulumunu destekleyebilir
- Bir `Satım tarafı süpürme` sonrası, yükseliş `MSS` uzun pozisyon kurulumunu destekleyebilir
6. FVG
`FVG`, üç mumluk dengesizlikle oluşturulan Adil Değer Boşluğudur.
FVG Göster
Etkinleştirildiğinde, gösterge görünür FVG bölgeleri çizer.
Tespit kuralı
- Boğa FVG: ilk mumun yüksek seviyesi üçüncü mumun düşük seviyesinin altındadır
- Ayı FVG: ilk mumun düşük seviyesi üçüncü mumun yüksek seviyesinin üstündedir
Min FVG Boyutu (Pip)
Bu, çok küçük boşlukları filtreler.
- Birim: `pip`
- Daha yüksek değer = daha az ama daha anlamlı FVG
- `0` = boyut filtresi yok
Grafik karışık olduğunda veya çok küçük 1-piksel boşluklar iş akışınız için faydasız olduğunda kullanışlıdır.
Doldurulmuş FVG'yi Kaldır
Etkinleştirildiğinde, tamamen doldurulmuş FVG'ler grafikden kaldırılır.
FVG stratejisi
İki yaygın yaklaşım:
1. Trend geri çekilmesi
- `BOS` veya `MSS` bekleyin
- Fiyatın FVG içine geri çekilmesini bekleyin
- Yapının yönünde işlem yapın
2. Onay temelli giriş
- Bir süpürme izleyin
- `MSS` bekleyin
- FVG'yi son geri çekilme bölgesi olarak kullanın
7. Önerilen İşlem Stilleri
Strateji A: Trend Devamı
Piyasa net bir şekilde trendde olduğunda en iyisidir.
İş akışı:
1. `BOS` bekleyin
2. OB'yi işaretleyin
3. OB veya FVG içine geri çekilmeyi arayın
4. Fiyat tepki verdikten sonra girin
Bu klasik bir trend takip yaklaşımıdır.
Strateji B: Süpürme Sonrası Dönüş
Piyasa volatil ve yanlış kırılmalara eğilimliyse en iyisidir.
İş akışı:
1. Bir `Alım tarafı süpürme` veya `Satım tarafı süpürme` tespit edin
2. Karşıt `MSS` için bekleyin
3. Geri çekilme bölgesi olarak OB veya FVG kullanın
4. Onay sonrası girin
Bu, süpürmeyi tek başına işlemeye göre daha güçlüdür.
Strateji C: Süpürme + MSS + OB/FVG Kesişimi
Bu, göstergenin kullanımının en temiz yollarından biridir.
İş akışı:
1. Bir süpürme alın
2. Bir MSS alın
3. OB veya FVG retestini bekleyin
4. Bölgeler üst üste bindiğinde işlem yapın
Bu, erken girişleri azaltır.
8. Hızlı Ayar Önerileri
- `Salınım Uzunluğu`: 5 veya 7 ile başlayın
- `Kırılma Kapanışı Kullanır`: daha muhafazakar bir görünüm için açın
- `Order Block Fitil Kullanımı`: daha geniş bölgeler için açın
- `Min FVG Boyutu (Pip)`: 2.0 ile başlayın ve enstrümana göre ayarlayın
- `Yapı Geçmişi` / `Order Block Geçmişi` / `FVG Geçmişi`: grafiğin okunabilir kalması için ayarlayın
9. Son Not
`WinSMC`, tek sinyal tetikleyicisi olarak değil, bir yapı haritası olarak en iyi şekilde kullanılır.
En güvenilir iş akışı şudur:
- Trend yönünü belirleyin
- Likidite süpürmesini izleyin
- MSS veya BOS bekleyin
- Giriş bölgesi olarak OB veya FVG kullanın
- Sadece onay sonrası girin
Özet
The indicator helps traders analyze price action by marking swing highs and lows, confirming valid swing points based on customizable swing length, and distinguishing breaks using candle closes or wick extremes. Order Blocks are displayed as supply/demand zones derived from the last opposite candle before a structure break, with options to adjust zone width. Liquidity Sweeps indicate price movements beyond prior highs or lows that close back inside, signaling potential setups rather than direct trade signals. FVG zones are identified by three-candle imbalances and can be filtered by minimum size and removed once filled.
WinSMC supports multiple trading strategies, including trend continuation after BOS, reversal setups following liquidity sweeps and MSS, and confluence-based entries combining sweeps, MSS, and retests of Order Blocks or FVGs. It is intended as a confirmation and structure mapping tool rather than an automated trading system, aiding traders in timing entries with contextual market information.

!["[CB] Pivot Points Pro" logosu](https://cdn.ctrader.com/image/webp/43463c82-67b0-4f10-a4ba-901bba091d81_32594)


