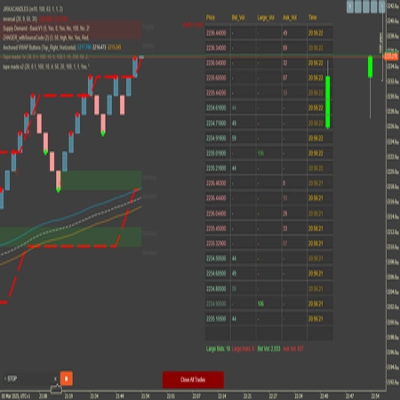
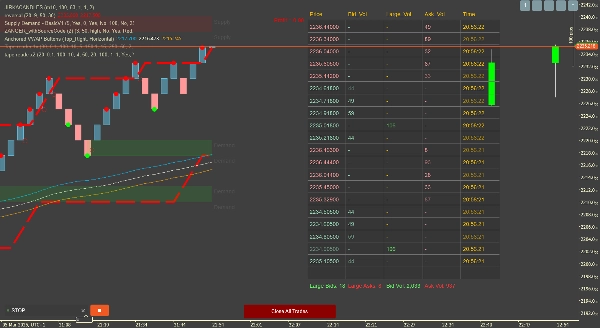
Brokerzy i firmy proptradingowe
Dla firm
00
Days
:
00
Hours
:
00
Minutes
:
00
Seconds
Tape reader
Logo „Tape reader”
Od 09/01/2025
Bezpłatne instalacje
6965
Przesłany obraz „Tape reader”

TAPE READER :-) Including large volumes cumulative delta, and

special collumn for Large volumes, Dont be Assholes and keep it free ;


PS: If you dont see the type reader on your chart, please play with the settings especially the Offset , Play with the settings until it look to your liking. It take some time so enjoy.

5.0
Opinie: 1
5
100 %
4
0 %
3
0 %
2
0 %
1
0 %
Opinie klientów
August 12, 2025
Pros: Real-time trade flow, customizable colors, great for scalping. Cons: No advanced filters, no alerts, limited historical storage.
Więcej od tego autora
Cumulative Delta Candles + VolumeProfile
Cumulative delta candles + volume profile
Support Resistance Zones
Support and Resistance.
VolumeProfile_8
Scalpers Volume Profile
DynamicVolumeSupplyDemand
Supply and Demand Zones
Wskaźnik
Grid
NAS100
NZDUSD
+17
Institutional Volume Supply Demand
Volume Profile Supply Demand
Insider_CumulativeDelta
Robust Cumulative delta,Atr and imbalance indicator.
Wskaźnik
NAS100
NZDUSD
XAUUSD
+13
ORDERFLOW_SKIA_Plynuly
This Indicator will show you Direction, Distance, and Time;
Wskaźnik
Breakout
BreakOut_Probability_Expo
Break Out Probability Experimental indicator. Credits for this indicator goes to Zeiierman !!!
MTF Candles
Multi Timeframe Candle drawing. Draw Any candles from any timeframe on your chart :-)
Cumulative Delta_noSourceCode
Demo of my main indcator.
Możesz także polubić
Wskaźnik
NAS100
NZDUSD
XAUUSD
+14
WVAP-Bands Indicator_noSourceCode
VWAP with standard deviation bands. Fully customizable colors, periods, and multipliers for precise trading signals
Wskaźnik
Breakout
3 Bar Triangle by Linda Raschke
3 bar triangle = high below 2 day high, low above 2 day low
[Stellar Strategies] BOS Trend 1.0
[Stellar Strategies] BOS Trend: Premium multi-timeframe BOS indicator for precision trend analysis.📈📉
Wskaźnik
Indices
RSI
StochasticRSI
Stochastic RSI (StochRSI) is a technical indicator used to measure the strength and weakness of the RSI.
Wskaźnik
Prop
Commodities
Stocks
+2
Light-Version BrickAlgo TrendPulse
🚀 Simplify Your Trading Decisions With Powerful Technical Analysis.
Session Highlight Framer
Frame the sessions
Wskaźnik
NAS100
XAUUSD
FVG
+6
Simple Smart Money Concepts
Simple Smart Money Concepts (SMC)
Wskaźnik
Indices
RSI
Prop
+4
SuperEmaColorRSI
This is a super indicator that integrates the RSI indicator with a dual moving average system.
Wskaźnik
ZigZag
Indices
Breakout
+1
Auto Tools Suite-Trial-7D
DEMO — 7‑day trial. The indicator deactivates after 7 days from Trial Start (UTC ISO8601) (or from first attach if empty
Wskaźnik
Indices
Stocks
Forex
+4
MACD Pro Trader
🚀 MACD Pro Trader – Advanced MACD with buy/sell signals, custom MAs & color-coded histograms for smarter trading! 📈🔥
Pivot Points
Pivot Points Indicator
Wskaźnik
NAS100
NZDUSD
XAUUSD
+15
Multi Time Frame Candles FVG Liqudity smc
Multi-Time Frame Candlesticks FVG with BSL/SSL Premium Suite
Wskaźnik
NAS100
NZDUSD
XAUUSD
+11
HKTrading Free ZigZag
Lightweight ZigZag tool for clear structure, swing highs/lows and liquidity-based analysis.
Wskaźnik
Grid
NAS100
NZDUSD
+19
Supertrend-algo
Algorithmic trend precision for cTrader.
Wskaźnik
NAS100
NZDUSD
Martingale
+26
Volume Profile Suite v1.1
VolumeProfileSuite is an advanced and flexible Volume Profile indicator for cTrader.
Wskaźnik
RSI
XAUUSD
Breakout
+6
PREMIUM SSL CHANNEL
SSL Channel: Tracks trends 📈 measures volatility ⚡filters noise via ATR+SSL. Clear signals for precise entries/exit...
Vishal Volume Profile v2.0
Volume Profile plots traded volume at each price level, highlighting high activity zones of precise support & resistance
Wskaźnik
Signal
Hammer Pattern Indicator