EKVWAP
Gösterge
2.53K i̇ndirmeler
Sürüm 1.0, Jan 2025
Windows, Mac
4.3
Değerlendirmeler: 6
Açıklama
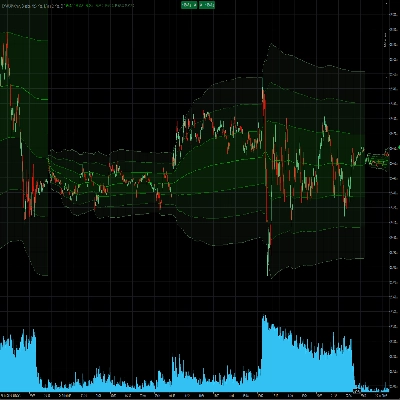
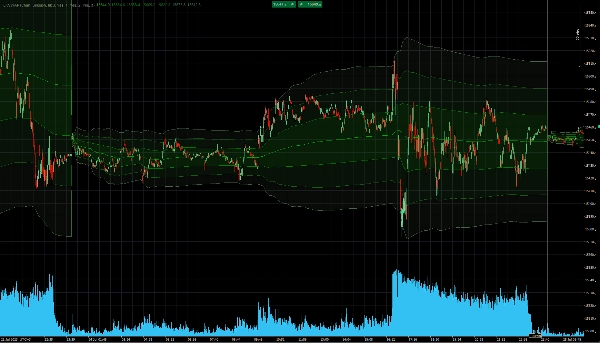
Bu, VWAP'ın tüm yönlerini özelleştirmenize olanak tanıyan gelişmiş bir göstergedir.
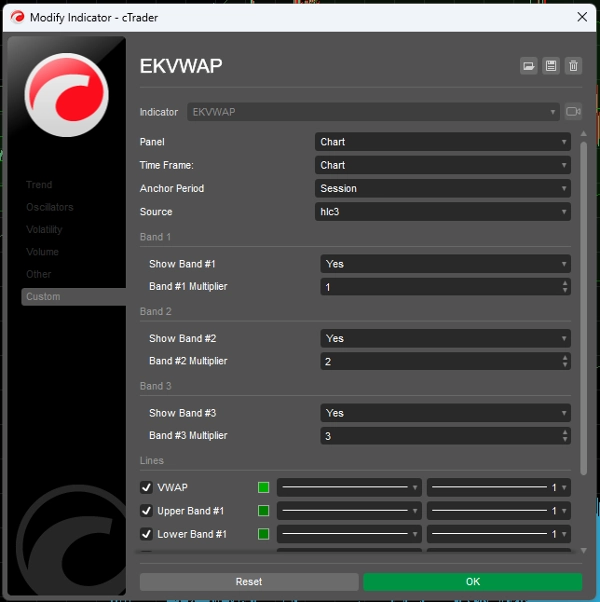
VWAP'ı şu şekilde sabitleyebilirsiniz:
- Manuel bir sabitleme noktasına.
- Aynı gün içinde birden fazla seansın olduğu piyasalarda (örneğin HK50 veya AUS200) Seansa göre,
- Güne göre
- Haftaya göre
En fazla 3 Standart Sapma bandının görüntülenmesini destekler. Her banda özel renkler atayabilir ve çarpanlarını ayarlayabilir veya sadece gizleyip/gösterebilirsiniz.
Manuel sabitleme noktası:
Grafikte bir bara tıkladıktan sonra, VWAP hesaplaması için manuel sabitleme noktasını ayarlamak üzere Alt-A tuşlarına (seçeneklerde yapılandırılabilir) basın. Hesaplama, Alt-A tuşlarına basarken bulunduğunuz noktadan başlayacaktır. Tekrar Alt-A tuşlarına basmak, manuel VWAP hesaplamasından çıkar ve önceki hesaba geri döner.
Özet
YZ özeti
EKVWAP is an advanced Volume Weighted Average Price (VWAP) indicator designed for customizable technical analysis. It allows users to anchor the VWAP calculation to various points, including a manual anchor set directly on the chart, by trading session (useful for markets with multiple daily sessions such as HK50 or AUS200), by day, or by week. The indicator supports the display of up to three standard deviation bands, each with configurable multipliers and colors, which can be shown or hidden according to user preference. Manual anchoring is enabled by selecting a bar on the chart and activating the anchor point via a configurable keyboard shortcut, allowing the VWAP calculation to start from that specific point. This flexibility facilitates detailed volume-based price analysis across different timeframes and market sessions.
Gösterge profili
Müşteri değerlendirmeleri
4.3
Değerlendirmeler: 6
5 | 50 % | |
4 | 33 % | |
3 | 17 % | |
2 | 0 % | |
1 | 0 % |
Müşteri değerlendirmeleri
August 21, 2025
Nice indicator. My major issue with it is that it automatically fills the bands with the colour selected for the lines. There is no facility to deselect this. Please add the capability to deselect band fill as it can be obtrusive, especially if using colours for another indicator on the chart.
July 9, 2025
Pros: Flexible anchored VWAP with customizable start point. Visual cloud of deviations. Easy integration and stable performance. Cons: No alerts on key levels. No statistics on VWAP re-tests. Lacks tooltip information and quick template saving.
June 18, 2025
June 5, 2025
Really good. all i think is left, is making one on UCT 0. Can you do That? I need to use this indicator to be a reference to a cBot, but i cant do that because the system dont have access to the code. Can you sell one to be used by cBot ¡please!.
Tartışma
SSS
VWAP
cTrader Store üzerinden erişilebilen işlem botları, göstergeler ve eklentiler gibi ürünler, üçüncü taraf sağlayıcılar tarafından sağlanır ve yalnızca bilgilendirme ve teknik erişim amaçlarıyla sunulur. cTrader Store bir broker değildir ve yatırım tavsiyesi, kişisel öneriler vermez veya gelecekteki performansı garanti etmez.


Fiyat
Başlangıç 27/11/2024
14.22M
İşlem hacmi
8.76K
Kazanılan pip
2.53K
Ücretsiz yüklemeler