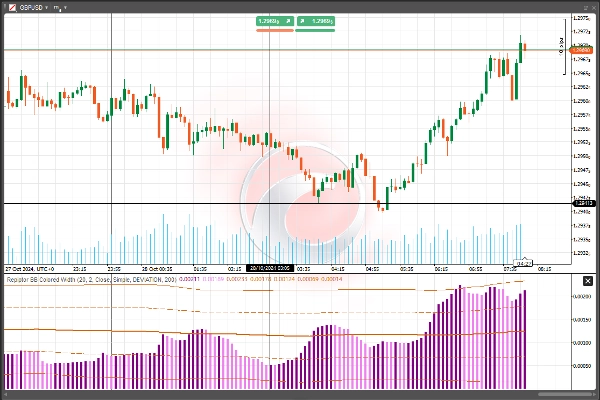
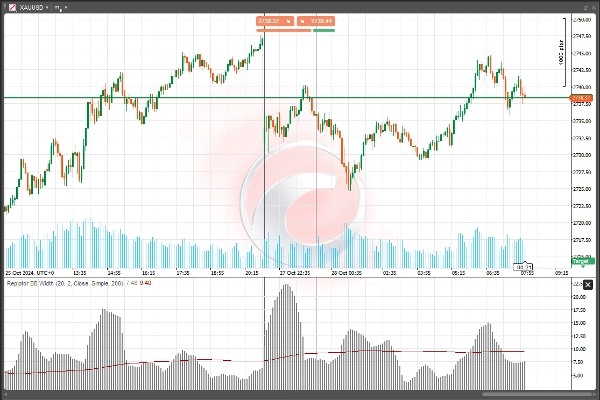
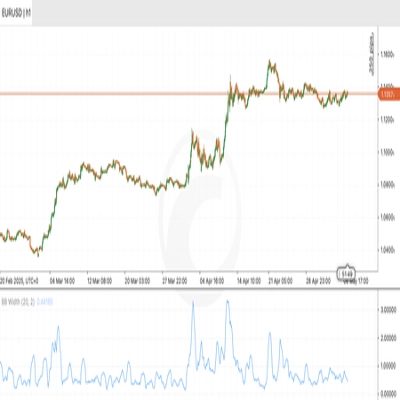
Brokerzy i firmy proptradingowe
Dla firm
00
Days
:
00
Hours
:
00
Minutes
:
00
Seconds
Wskaźnik
Bollinger
Repiptor BB Width
03/09/2025
80
Desktop
Od 26/10/2024
Bezpłatne instalacje
1015
Przesłany obraz „Repiptor BB Width”Przesłany obraz „Repiptor BB Width”

Bollinger Bands Width with dynamic average level

0.0
Opinie: 0
Opinie klientów
Ten produkt nie ma jeszcze opinii. Wypróbowałeś(-aś) go już? Bądź pierwszy(-a) i powiedz o tym innym!
Więcej od tego autora
Repiptor Candlescope Lite
Candlestick pattern detector lite version
Repiptor RSI Amplified
RSI Amplified
Wskaźnik
Bollinger
Repiptor BB Colored Width
Colored Bollinger Bands Width
Możesz także polubić
Wskaźnik
Indices
Stocks
Commodities
+2
SymbolTFOverlay
The SymbolTFOverlay display the current symbol and timeframe as a semi-transparent text overlay on the chart.
Wskaźnik
RSI
Signal
MACD
+1
Long Wick
Identify potential reversal points in the market by detecting candles with exceptionally long upper or lower wicks
IR Macd on Chart
this indicator show macd on chart.
Wskaźnik
NAS100
NZDUSD
Martingale
+26
DIGITAL IMPLEMENTATION SYSTEM
LudwigICT – Digital Root & IDR (cTrader Automate)
Wskaźnik
RSI
XAUUSD
Breakout
+5
Dynamic Range MomentumI
This histogram helps visualize the strength and direction of market movements, making it easier to spot potential trends
Wskaźnik
NAS100
NZDUSD
XAUUSD
+16
Candles Volume Delta
CANDLES VOLUME DELTA
Candelstick xxl
The indicator is designed to detect aggressive movements in the market and without volume for trend changes.
Wskaźnik
NAS100
RSI
NZDUSD
+15
RSI + EMA Crossover Signals
Dual confirmation RSI + EMA crossover signals with visual alerts and dynamic ATR offsets.
Wskaźnik
NAS100
NZDUSD
Martingale
+26
Trend & Volume Regime Map
Trend & Volume Regime Map – A normalized price & volume regime map for cTrader that scores trend from –10 to +10, colors
Wskaźnik
Indices
Commodities
Stocks
+2
Volume Activity Profiler
Volume profiler applying Wyckoff effort vs result and spread analysis with visual bar graphs.
[Hamster-Coder] Pivot Points (Demo)
[Hamster-Coder] Pivot Points (Demo)
Wskaźnik
Grid
NAS100
RSI
+20
QX RiskShield
Risk-first position sizing panel for indices and FX majors. Clean. Non-repainting. Built for real trading.
Wskaźnik
Grid
NAS100
NZDUSD
+15
SystemAlgo1
Institutional Supply & Demand Mapping Across Five Timeframes — Automatically.
Wskaźnik
RSI
Indices
Signal
[Stellar Strategies] MARSI Signal Plotter
🚀📈 Plot buy/sell signals on Range Bars using Moving Averages and RSI. Clear, actionable trading insights.🚀📈
Najwyżej oceniane
Za darmo
FairValueGap
This Fair Value Gap (FVG) indicator is a technical analysis tool used to identify potential price imbalances.
Wskaźnik
Grid
RSI
Breakout
+19
Buy and sell indicator
Buy and Sell Signals
Weekly Daily Levels
The Weekly Daily Levels indicator shows the OHLC, and mid-point prices for the previous day and week.
Volume Profile Analytics
Volume distribution analysis with Market Profile TPO integration.