
ADX and ADI
Wskaźnik
258 pobrania
Wersja 1.0, Aug 2025
Windows, Mac
5.0
Opinie: 2
Od 21/02/2025
466.3M
Wolumen transakcji
180.83K
Zysk w pipsach
22
Sprzedaż
6.89K
Bezpłatne instalacje
Opis
Kluczowe cechy:
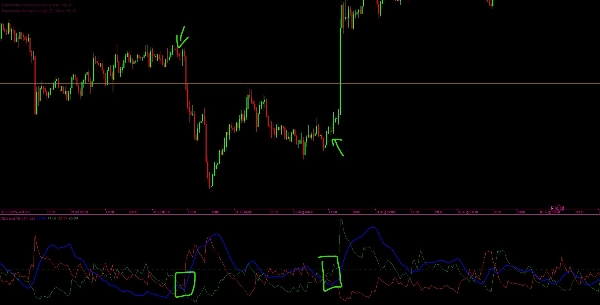
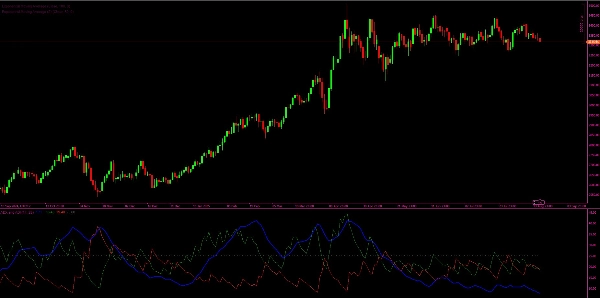
- Linia ADX i ADI (Niebieska): Pokazuje wygładzoną siłę bieżącego trendu, niezależnie od kierunku.
- Linia +DI (Zielona): Wskazuje siłę ruchów wzrostowych.
- Linia -DI (Czerwona): Wskazuje siłę ruchów spadkowych.
- Linia progowa (Szara): Poziom odniesienia poziomy (domyślnie 25), który pomaga określić, czy siła trendu jest znacząca.
Jak to działa:
- Wskaźnik oblicza True Range (TR), Pozytywny Ruch Kierunkowy (+DM) oraz Negatywny Ruch Kierunkowy (-DM).
- Stosuje technikę wygładzania Wildera do obliczenia wygładzonych wartości TR, +DM i -DM.
- Na ich podstawie wyprowadza się Wskaźniki Kierunkowe (+DI i -DI), pokazujące, która strona (byki lub niedźwiedzie) ma silniejszy impet.
- Oblicza się DX (Wskaźnik Kierunkowy) na podstawie względnej różnicy między +DI a -DI.
- Na koniec oblicza się ADX (Średni Wskaźnik Kierunkowy) jako wygładzoną wersję DX, dostarczającą miarę ogólnej siły trendu.
Interpretacja:
- Gdy ADX jest powyżej progu (np. 25), rynek jest uważany za silnie trendujący.
- Gdy +DI > -DI, byki kontrolują rynek (trend wzrostowy).
- Gdy -DI > +DI, niedźwiedzie kontrolują rynek (trend spadkowy).
- Gdy ADX jest poniżej progu, rynek jest uważany za konsolidujący się (słaby lub brak trendu).
Podsumowanie
Podsumowanie AI
This custom indicator provides a full implementation of the Average Directional Index (ADX) and Directional Indicators (DI) to measure trend strength and direction in financial markets. It displays four key lines: the ADX and ADI line (blue) representing smoothed trend strength regardless of direction; the +DI line (green) indicating upward movement strength; the -DI line (red) indicating downward movement strength; and a threshold line (gray, default 25) to identify significant trend strength.
The indicator calculates True Range (TR), Positive Directional Movement (+DM), and Negative Directional Movement (-DM), applying Wilder’s smoothing technique to derive smoothed values. From these, it computes the +DI and -DI lines to show bullish or bearish momentum. The Directional Index (DX) is calculated from the relative difference between +DI and -DI, and the ADX is a smoothed version of DX, quantifying overall trend strength.
Interpretation guidelines include: ADX above the threshold signals a strong trend; +DI greater than -DI indicates bullish control; -DI greater than +DI indicates bearish control; and ADX below the threshold suggests a ranging or weak trend market.
Profil wskaźnika
Opinie klientów
5.0
Opinie: 2
5 | 100 % | |
4 | 0 % | |
3 | 0 % | |
2 | 0 % | |
1 | 0 % |
Opinie klientów
December 1, 2025
ADX and ADI delivers clean trend strength and direction signals. ADX shows when the market is actually trending, while +DI and -DI reveal who’s in control. Stable, lightweight and reliable across all timeframes. Best on H1+ for smoother signals. Alerts and zone-highlighting would be great additions.
September 12, 2025
Dyskusja
Częste pytania
Produkty dostępne za pośrednictwem cTrader Store, w tym boty handlowe, wskaźniki i wtyczki, dostarczane są przez deweloperów zewnętrznych i udostępniane wyłącznie w celach informacyjnych oraz w celu zapewnienia dostępu technicznego. cTrader Store nie jest brokerem i nie zapewnia doradztwa inwestycyjnego, nie udziela spersonalizowanych rekomendacji ani nie gwarantuje przyszłych wyników.


![Logo „Trend Angle Indicator [Iridio Capital]”](https://cdn.ctrader.com/image/webp/28a98496-3412-4fea-82eb-be3347bdd6f1_27612)


Cena
Od 21/02/2025
466.3M
Wolumen transakcji
180.83K
Zysk w pipsach
22
Sprzedaż
6.89K
Bezpłatne instalacje