

DailyTargets
Indicatore
223 download
Versione 1.0, May 2026
Windows, Mac
5.0
Recensioni: 2
Da 21/02/2025
466.3M
Volume negoziato
180.83K
Profitto in pip
26
Vendite
7.43K
Installazioni gratuite
Descrizione
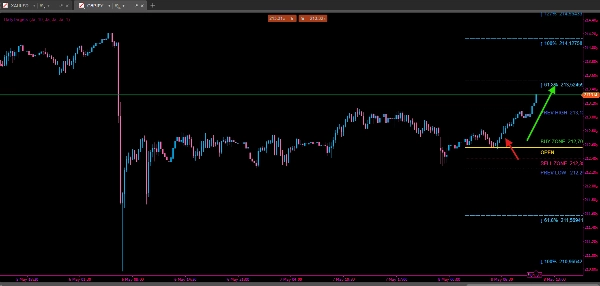
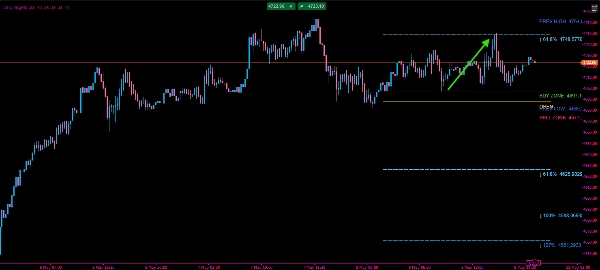
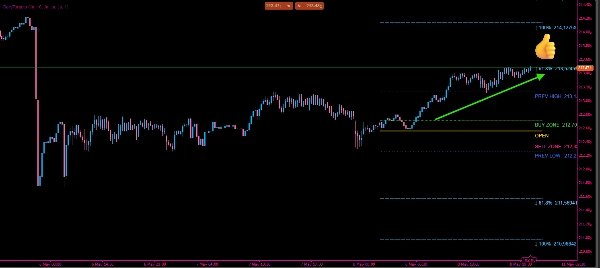
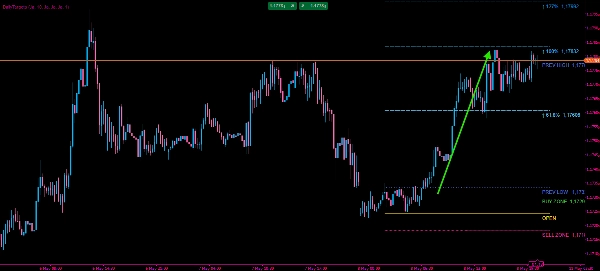
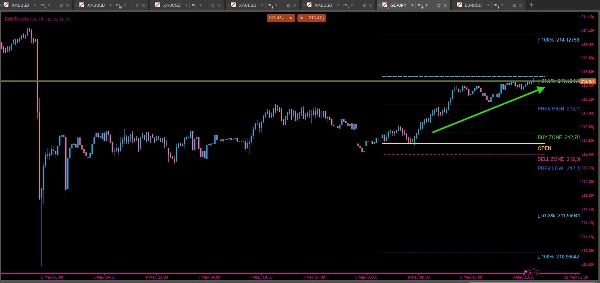
Migliora la precisione del tuo trading quotidiano con DailyTargets, un indicatore sovrapposto completo progettato per evidenziare i livelli istituzionali chiave e gli obiettivi basati sulla volatilità. Utilizzando una media multiperiodo dell'Average Daily Range (ADR), questo strumento fornisce una chiara roadmap per ogni sessione di trading.
Caratteristiche principali:
- Zone di acquisto/vendita dinamiche: Calcola automaticamente le zone di ingresso basate su una percentuale della volatilità giornaliera dall'apertura del mercato.
- Obiettivi di volatilità: Traccia livelli chiari di presa di profitto basati sui rapporti di Fibonacci e ADR standard (61,8%, 100%, 127%, 161% e 200%).
- Contesto di mercato: Mostra i livelli High e Low del giorno precedente per identificare potenziali punti di breakout o inversione.
- Avvisi in tempo reale: Rimani informato con notifiche istantanee quando il prezzo attraversa l'apertura giornaliera, segnalando un potenziale cambiamento nella tendenza intraday.
- Completamente personalizzabile: Regola larghezze delle linee, stili e visibilità dei singoli componenti per adattarli al tuo template personale del grafico.
Logica tecnica: L'indicatore calcola una media ponderata dell'ADR (1, 5, 10 e 20 periodi) per fornire una misura della volatilità levigata ma reattiva. Questo garantisce che i tuoi obiettivi si adattino alle condizioni di mercato attuali, sia che il mercato sia in trend o in consolidamento.
Riepilogo
AI summary
DailyTargets is a trading indicator that overlays dynamic, volatility-based levels and targets on price charts. It calculates a weighted average of the Average Daily Range (ADR) across multiple periods (1, 5, 10, and 20) to provide smoothed, adaptive volatility measurements. Key features include automatically generated Buy and Sell zones based on a percentage of daily volatility from the market open, and plotted profit-taking targets using Fibonacci and standard ADR ratios (61.8%, 100%, 127%, 161%, and 200%). The indicator also displays the previous day's High and Low levels to help identify potential breakout or reversal points. Real-time alerts notify users when the price crosses the daily open, signaling possible intraday trend shifts. Users can customize line widths, styles, and visibility of individual components to fit their chart preferences. DailyTargets supports visualization of key institutional levels and volatility targets to assist traders in planning entries, exits, and managing intraday market context.
Profilo indicatore
Categoria indicatore
Supporto e resistenza
Tipo di output
Visualizzazione
Requisiti per i dati
Solo barre
Segnali supportati
Rottura
Livello rotto
Livello raggiunto
Intervallo di apertura della sessione
Recensioni dei clienti
5.0
Recensioni: 2
5 | 100 % | |
4 | 0 % | |
3 | 0 % | |
2 | 0 % | |
1 | 0 % |
Recensioni dei clienti
September 10, 2026
DailyTargets is a practical ADR-based overlay that clearly displays the daily open, Buy/Sell zones, previous-day High/Low and 61.8–200% volatility targets. Testing on EURUSD and XAUUSD showed clean intraday rendering and good M1/H1 consistency. The main limitations were reduced readability on very high timeframes and an unusual D1 display state that deserves clarification. Alerts and the exact weighted ADR formula were not independently verified, but the core visual functionality performed well.
May 27, 2026
The setup is straightforward and it integrates smoothly into my existing chart layout. It works well across different timeframes and asset classes, which makes it very versatile.
Discussioni
Domande frequenti
Fibonacci
Key Levels
I prodotti disponibili tramite cTrader Store, inclusi bot di trading, indicatori e plugin, sono forniti da sviluppatori terzi e resi disponibili esclusivamente a scopo informativo e di accesso tecnico. cTrader Store non è un broker e non fornisce consulenze in materia di investimento, raccomandazioni individualizzate o garanzie di risultati futuri.






























Prezzo
Da 21/02/2025
466.3M
Volume negoziato
180.83K
Profitto in pip
26
Vendite
7.43K
Installazioni gratuite