Descrizione
G.A.S - Smart Entry Zone è un indicatore di price action per US500 (S&P 500 CFD) che aiuta
i trader a identificare punti di ingresso ad alta probabilità intorno a una zona di prezzo definita manualmente.
--- COSA ANALIZZA ---
L'indicatore monitora il comportamento del prezzo intorno a due livelli orizzontali definiti dall'utente - i
confini superiore e inferiore della Smart Entry Zone. Tiene traccia di come il prezzo si avvicina,
trapassa e reagisce a questi livelli barra per barra, cercando specifici
schemi di conferma prima di generare un segnale.
--- COME INTERPRETARE I SEGNALI E GLI ELEMENTI VISIVI ---
Le linee della zona segnano i confini superiore e inferiore della zona di ingresso per il
giorno di trading selezionato. Vengono rilevati tre tipi di segnale:
- Caso A - Il prezzo punge attraverso la zona e poi chiude di nuovo al di fuori di essa. Una candela successiva che chiude nella direzione della rottura genera il segnale. Un segnale
per evento di penetrazione (one-shot).
- Caso B - La barra precedente ha chiuso fuori dalla zona, la barra attuale punge attraverso di essa e
chiude di nuovo fuori. Conferma un retest del confine della zona.
- Caso C - All'apertura esatta della finestra temporale del segnale, il prezzo è già posizionato
oltre la zona. La prima candela di conferma in quella direzione genera il segnale.
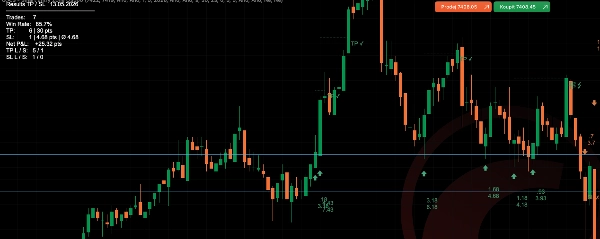
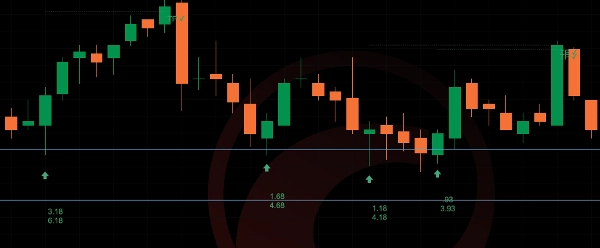
I segnali sono visualizzati come frecce sotto (rialziste) o sopra (ribassiste) la barra del segnale.
Quando la visualizzazione TP/SL è abilitata, linee tratteggiate mostrano i livelli di take profit e stop loss
dalla barra di ingresso. Un'etichetta TP o SL indica l'esito quando il livello viene raggiunto.
L'etichetta opzionale SL Distance mostra in tempo reale quanto il prezzo corrente è distante
dal confine della zona di stop loss.
--- IMPOSTAZIONI E PARAMETRI PRINCIPALI ---
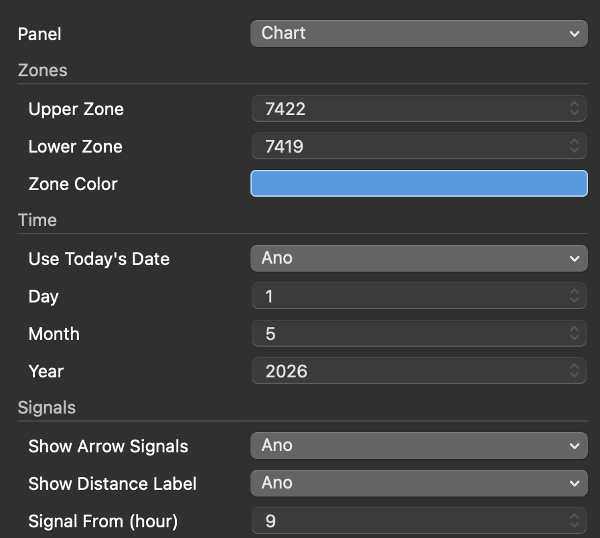
- Zone: livello di prezzo superiore e inferiore, colore della linea, mostra/nascondi
- Data: usa automaticamente la data odierna o imposta manualmente una data specifica
- Segnali: abilita frecce, configura finestra temporale (es. 15:30 / 23:00), lookback penetrazione
(quante barre dopo una penetrazione il segnale rimane valido), etichette distanza on/off
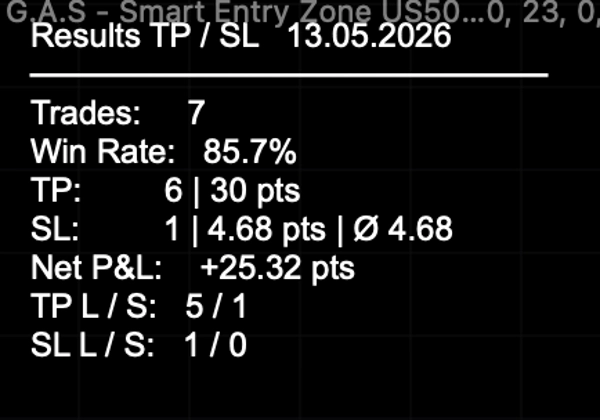
- TP/SL: take profit in punti, mostra linee ed etichette, tabella risultati on/off,
modalità trade singolo (una posizione aperta alla volta), colori personalizzati
- SL Distance: abilita etichetta, colore personalizzato
--- CASI D'USO TIPICI E SCENARI DI TRADING ---
L'indicatore è progettato per il trading intraday di US500 su un grafico a 5 minuti. Un tipico
flusso di lavoro è: prima dell'apertura del mercato USA, il trader imposta i livelli superiore e inferiore della zona
per la giornata. Una volta che si apre la finestra del segnale (default 15:30 Praga / 09:30 New York), l'
indicatore monitora i setup Caso A, B o C e marca gli ingressi validi con frecce.
Il tracker TP/SL registra automaticamente i risultati durante la sessione.
--- A CHI È PIÙ ADATTO QUESTO INDICATORE ---
Trader di livello intermedio-avanzato che hanno già una metodologia intraday definita e
usano zone di prezzo fisse come parte del loro processo decisionale. L'indicatore non
genera automaticamente le zone - il trader deve identificare e inserire manualmente i livelli
ogni giorno. Non è adatto ai principianti che cercano un sistema di segnale completamente automatizzato.
--- LIMITAZIONI IMPORTANTI E NOTE SULL'USO ---
- I livelli della zona devono essere inseriti manualmente ogni giorno di trading - l'indicatore non
li calcola automaticamente.
- Progettato e testato per US500 su un grafico a 5 minuti. Il comportamento su altri strumenti
o timeframe non è garantito.
- Le statistiche dei segnali passati mostrate nella tabella dei risultati sono solo a scopo di riferimento e non
rappresentano una garanzia di performance futura.
- La finestra temporale del segnale utilizza internamente l'ora di Praga (CET/CEST). Regolare le
impostazioni da/a se il vostro broker usa un orario server differente.
Riepilogo
Signals appear as arrows indicating bullish or bearish entries, with optional automatic tracking and display of take profit (TP) and stop loss (SL) levels, including real-time SL distance labels. Users can customize zone levels, signal time windows, TP/SL parameters, and visual elements. The indicator logs trade statistics throughout the session for performance reference.
Intended for intermediate to advanced traders who incorporate fixed price zones into their intraday strategies, it requires manual input of zone levels daily and is specifically tailored for the US500 instrument. The indicator does not generate zones automatically and is not designed for other instruments or timeframes. Time settings use Prague time internally and should be adjusted if needed.