
3 Bar Triangle by Linda Raschke
Индикатор
535 скачивания
Версия 1.0, Sep 2024
Windows, Mac
5.0
Отзывы: 1
Описание
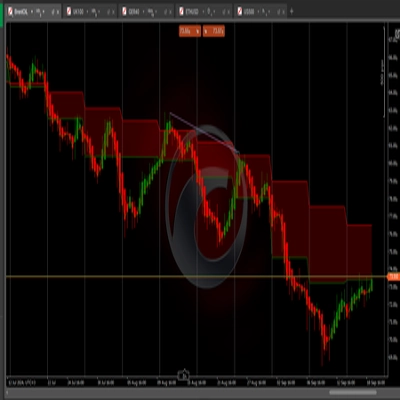
Этот паттерн указывает на консолидацию или сжатие цены, когда цена сужается в более узком диапазоне. Рынок "заворачивается" для потенциального прорыва в любом направлении, что обычно приводит к резкому движению после выхода из треугольника.
Торговля прорывом:
- Вход: Трейдеры ищут прорыв выше максимума паттерна или ниже минимума паттерна, указывающий направление следующего движения.
- Стоп-лосс: Размещение стоп-лосса за противоположной стороной треугольника (либо выше максимума, либо ниже минимума) помогает управлять рисками.
- Цели: Некоторые трейдеры нацеливаются на движение цены, равное размеру треугольника (расстояние между максимумом и минимумом первой свечи)
Сводка
Профиль индикатора
Отзывы покупателей
5.0
Отзывы: 1
5 | 100 % | |
4 | 0 % | |
3 | 0 % | |
2 | 0 % | |
1 | 0 % |
Отзывы покупателей
August 12, 2025
Pros: Identifies classic 3-bar triangle consolidation zones. Simple setup, visually clear. Stable across timeframes. Cons: No alerts or tooltips. Lacks volume filters and signal confirmation. Limited customization
Обсуждение
Частые вопросы
Breakout
Продукты, доступные в cTrader Store, включая торговых ботов, индикаторы и плагины, предоставляются сторонними разработчиками и доступны исключительно в информационных и технических целях. cTrader Store не является брокером и не предоставляет инвестиционные консультации, персональные рекомендации или какие-либо гарантии будущей доходности.
Больше от этого автора


Цена
С 19/09/2024
314.61K
Торгуемый объем
258.47K
Выигранные пипы
535
Бесплатные установки