
Daily TPO profile
Индикатор
213 скачивания
Версия 1.0, Nov 2025
Windows, Mac
Описание
Ежедневный профиль TPO
Индикатор ежедневного профиля TPO, который рассчитывает POC, VAH и VAL для каждой сессии.
Отображает точку контроля и 70% зону стоимости непосредственно на графике, помогая определить зоны справедливой стоимости, ключевые уровни поддержки/сопротивления и потенциальные области отторжения или принятия цены.
Как это работает
Этот индикатор строит ежедневный профиль TPO (Time Price Opportunity), похожий на рыночный профиль.
Для каждого бара торгового дня он:
- разбивает ценовую ось на фиксированные «шаги», определяемые «Размером строки (пипсы)»
- для каждого ценового шага считает, сколько баров коснулось этого уровня (TPO = сколько раз цена торговалась на этом уровне)
- в конце дня рассчитывает:
-
- POC (Точка контроля) → ценовой уровень с наибольшим количеством TPO (где рынок провел больше всего времени)
- VAH (Верхняя граница зоны стоимости) и VAL (Нижняя граница зоны стоимости) → ценовые уровни, содержащие примерно процент зоны стоимости (по умолчанию 70%) всех TPO за эту сессию
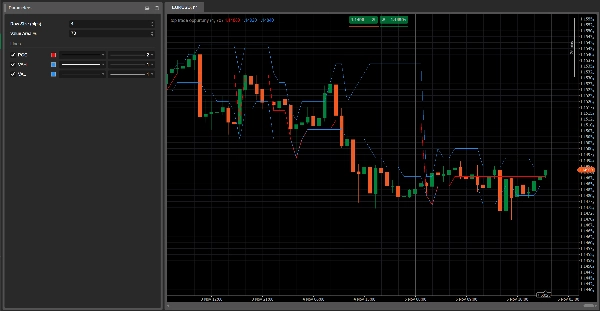
Индикатор отображает три горизонтальные линии на графике:
- Красная линия → POC
- Синие линии → VAH (верхняя) и VAL (нижняя)
Эти линии обновляются по каждому бару в течение сессии и сбрасываются при начале нового торгового дня.
Основные параметры
Размер строки (пипсы)
Определяет толщину каждого ценового шага в профиле.-
- Меньшие значения = более детализированный профиль
- Большие значения = более сглаженный профиль
Процент зоны стоимости
Процент от общего количества TPO, содержащихся внутри зоны стоимости (обычно 70%).
Зона стоимости — это ценовая зона, где происходила большая часть рыночной активности в течение дня.
Как читать
- POC (красная линия)
-
- Ценовой уровень, наиболее «принятый» рынком в этот день.
- Часто выступает как уровень равновесия: цена может отскочить, задержаться или резко пробить эту зону.
- Зона стоимости (VAH–VAL, синие линии)
-
- Представляет зону «справедливой стоимости», где происходило большинство торгов.
- Движение цены относительно VAH/VAL может показывать:
-
- Отторжение экстремальных цен (ложные пробои за пределами VAH/VAL)
- Принятие новых цен (консолидация вне зоны стоимости)
Типичные идеи использования
- Цена отторгает VAL и возвращается внутрь зоны стоимости → потенциальная идея на покупку, ставка на возврат к «справедливой стоимости» (среднее отклонение).
- Цена пробивает VAH с силой и начинает формировать структуру выше → потенциальное начало новой зоны более высокой стоимости (сценарий следования за трендом).
- Несколько дней с POC около одного уровня → сильная зона равновесия/накопления, часто ключевая поддержка/сопротивление.
Сводка
ИИ-сводка
The Daily TPO Profile indicator constructs a daily Time Price Opportunity (TPO) profile similar to a Market Profile, analyzing market activity by price levels throughout each trading session. It divides the price axis into fixed increments ("Row Size" in pips) and counts how many bars traded at each price step, representing TPOs. At the end of the session, it calculates three key levels: the Point of Control (POC), where the market spent the most time; the Value Area High (VAH); and the Value Area Low (VAL), which together define the price range containing approximately 70% of the trading activity.
The indicator plots these levels as horizontal lines on the chart—POC in red, VAH and VAL in blue—updating them bar by bar during the session and resetting daily. Traders use the POC as an equilibrium price level that may act as support or resistance. The Value Area highlights fair value zones, with price action near VAH and VAL signaling potential rejection or acceptance of price extremes. Typical applications include identifying mean reversion opportunities when price rejects VAL or trend-following setups when price breaks above VAH.
Main adjustable parameters include Row Size (pips), controlling profile detail, and Value Area %, defining the percentage of TPOs included in the value area. The indicator supports analysis across various markets including forex, indices, commodities, stocks, and cryptocurrencies.
Профиль индикатора
Отзывы покупателей
0.0
Отзывы: 0
Отзывы покупателей
У этого продукта еще нет отзывов. Уже попробовали его? Поделитесь впечатлениями!
Обсуждение
Частые вопросы
Signal
Indices
Commodities
GBPUSD
RSI
Bollinger
Fibonacci
Scalping
AI
XAUUSD
NAS100
MACD
BTCUSD
Forex
Breakout
EURUSD
NZDUSD
Martingale
Prop
ZigZag
Supertrend
Fair Value Gap
SMC
Crypto
Grid
Stocks
ATR
USDJPY
VWAP
Продукты, доступные в cTrader Store, включая торговых ботов, индикаторы и плагины, предоставляются сторонними разработчиками и доступны исключительно в информационных и технических целях. cTrader Store не является брокером и не предоставляет инвестиционные консультации, персональные рекомендации или какие-либо гарантии будущей доходности.


Цена
42.11M
Торгуемый объем
6.13M
Выигранные пипы
224
Продажи
8.41K
Бесплатные установки