الوصف
مؤشرات متجر Pinescriptlabs: روبوتات cBot لمتجر Pinescriptlabs : (cBot) اختراق الذهب و BTCمحاور الجلسة(جديد)
دعم SmartTrend و
المقاومة
الخطوط
تحليل
هيكل السوق الديناميكي
لـ
نقاط
الانعطاف
فيبوناتشي
انحدار خطي
متعدد الأطر الزمنية
متعدد المستويات
متعصب الشمعة
المتعقب
جميع
مستويات الدعم
والمقاومة
المستويات
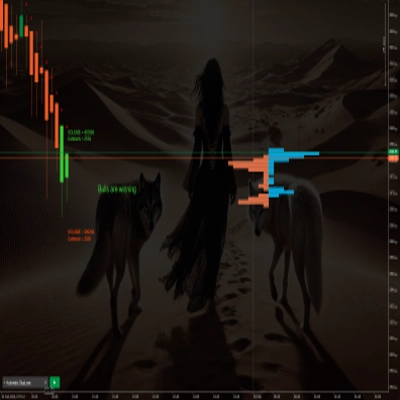
كاشف اختلال توازن السوق يحدد اختلالات السوق ويحدد بصريًا المناطق الرئيسية بناءً على أنماط السعر والتقلب (ATR). إليك شرح بسيط لكيفية عمله:
🔍 كشف الإشارة
يقارن أسعار الأشرطة السابقة لاكتشاف أنماط صعودية أو هبوطية. باستخدام شروط محددة (مثل مقارنة أدنى وأعلى الأشرطة السابقة) وتصفيه الإشارات بالتقلب الحالي، يضمن أن الحركة مهمة.
📊 تصوير الاختلالات
عند تحديد إشارة، يرسم المؤشر على الرسم البياني:
- منطقة اختلال (مستطيل) يحدد المنطقة التي حدث فيها النمط.
- خط مستوى متوسط (محسوب من القمم والقيعان ذات الصلة) للمساعدة في تصور الدعم أو المقاومة.
- أيقونة (سهم) يشير إلى اتجاه الإشارة (⬆️ للصعود، ⬇️ للهبوط).
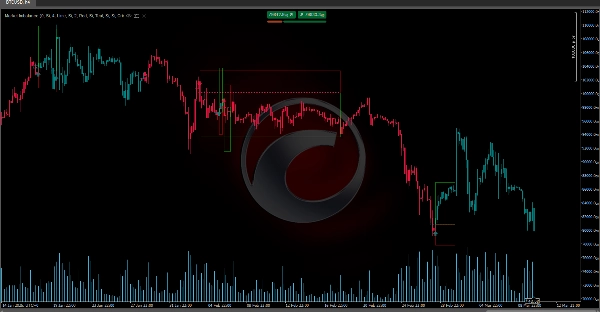
مناطق OP/PE
بالإضافة إلى ذلك، ينشئ مناطق تسمى OP () و PE (نقطة الهروب). يتم حساب هذه المناطق عن طريق إضافة أو طرح مضاعف من ATR إلى المستوى المتوسط، مما يساعد في تحديد مناطق لجني الأرباح أو تقليل الخسائر.
الملخص
When a signal is detected, the indicator visually marks the chart with:
- An Imbalance Area (a rectangle) highlighting the zone where the pattern occurred.
- An Average Level Line calculated from relevant highs and lows to indicate potential support or resistance.
- An Icon (arrow) showing the signal direction: upward for bullish and downward for bearish.
Additionally, the indicator calculates OP (Order Point) and PE (Escape Point) zones by adding or subtracting multiples of ATR to the average level. These zones assist traders in defining areas for taking profit or cutting losses.
This tool supports analysis across various markets including cryptocurrencies (e.g., BTCUSD), commodities (e.g., XAUUSD), and integrates concepts related to breakout strategies, trend indicators like Supertrend, and momentum measures such as RSI. It is intended to enhance market structure understanding and assist in decision-making by visually representing key imbalance zones on trading charts.