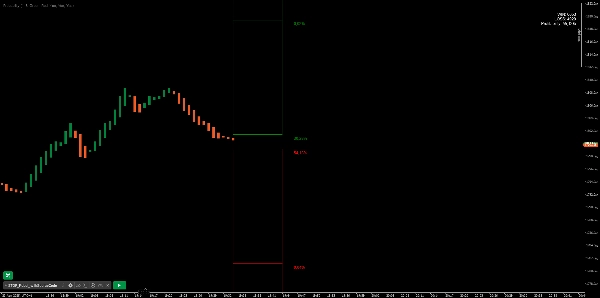
BreakOut_Probability_Expo
Логотип продукта "BreakOut_Probability_Expo"
4.0
03/09/2025
163
Desktop
Загруженное изображение продукта "BreakOut_Probability_Expo"Загруженное изображение продукта "BreakOut_Probability_Expo"Загруженное изображение продукта "BreakOut_Probability_Expo"Загруженное изображение продукта "BreakOut_Probability_Expo"

Breakout Probability is a valuable indicator that calculates the probability of a new high or low and displays it as a level with its percentage. The probability of a new high and low is backtested, and the results are shown in a table— a simple way to understand the next candle's likelihood of a new high or low. In addition, the indicator displays an additional four levels above and under the candle with the probability of hitting these levels.

The indicator helps traders to understand the likelihood of the next candle's direction, which can be used to set your trading bias.


█ Calculations

The algorithm calculates all the green and red candles separately depending on whether the previous candle was red or green and assigns scores if one or more lines were reached. The algorithm then calculates how many candles reached those levels in history and displays it as a percentage value on each line.


█ Example

In this example, the previous candlestick was green; we can see that a new high has been hit 72.82% of the time and the low only 28.29%. In this case, a new high was made.

Больше от этого автора
Cumulative Delta Candles + VolumeProfile
Cumulative delta candles + volume profile
Высокий рейтинг
Бесплатно
Support Resistance Zones
Support and Resistance.
Insider_CumulativeDelta
Robust Cumulative delta,Atr and imbalance indicator.
MTF Candles
Multi Timeframe Candle drawing. Draw Any candles from any timeframe on your chart :-)
Индикатор
Grid
NAS100
NZDUSD
+17
Institutional Volume Supply Demand
Volume Profile Supply Demand
Индикатор
NAS100
NZDUSD
XAUUSD
+13
ORDERFLOW_SKIA_Plynuly
This Indicator will show you Direction, Distance, and Time;
Вам также может понравиться
Ctrader Liniar Chart
Simple and efficient Indicator Designed to be profitable .With alarms for trend changes and support - resistance
Индикатор
RSI
Breakout
XAUUSD
+13
Fear & Greed Index
Fear & Greed Index: 4 configurable components (momentum, volatility, strength, pattern) with 6 calculation methods each
Индикатор
NZDUSD
Forex
EURUSD
+2
4 RCS Relative Strength w Alerts_NSC
Forex Strength Meter for cTrader: 4 custom currencies, cross alerts, visual arrows. Trade smarter!
Candle Timer & Strength Demo
Candle Timer & Strength DEMO for cTrader This is a DEMO version of the Candle Timer & Strength indicator. You can use al
Chaikin Money Flow
Chaikin money flow's primary purpose is to distinguish between periods of accumulation and distribution of a security.
Market Sessions
Market Sessions is very important for traders.
Индикатор
NAS100
NZDUSD
RSI
+12
TrendFibonacci
The TrendFibonacci indicator is a powerful tool for traders, combining Fibonacci retracement levels
Fibonacci Pitchfan
Powerful all-in-one tool for traders seeking a clear, dynamic view of market structure. By merging pivots, trendlines &
Индикатор
Indices
RSI
Bollinger
Clustering
Clustering tool for traders with visual insights into market patterns.
Популярный
$ 10
Индикатор
Indices
Prop
Commodities
+4
TrendPulse
BrickAlgo TrendPulse is an advanced technical analysis tool that combines multiple indicators with filterin mechanisms.
Fx4U.Multi Trend Line Indicator
Allow trader to draw multi trendlines in different timeframes on one chart,Give trader an overview of the current market
BB Width
Indicatore di volatilità che filtra quando le bande di Bollinger sono in espansione
Популярный
$ 15
/
$19
Индикатор
RSI
Breakout
MACD
ZigZagColor
The ZigZag indicator is a technical analysis tool primarily used to identify key price reversal points.
Индикатор
Grid
NAS100
NZDUSD
+17
Institutional Volume Supply Demand
Volume Profile Supply Demand
Bollinger Bands Breakout Oscillator (+ Alerts)
BB Breakout Oscillator with alerts! Spot trend reversals using Bollinger Bands. Bullish/Bearish crossovers Alerts.
Moving Average Plus
10 configurable moving averages: choose type, period, color per line; single price source for all.
Candles_Painter
Overlay HTF context on any chart: color bars by HTF and draw filled HTF bodies with optional High/Low lines.