Описание
Индикаторы Pinescriptlabs Store: 🤖Pinescriptlabs Store cBots:
SmartTrend Support &
Resistance Lines Gold & BTC BreakoutSession Pivots(новый)YieldShield" 🛡️
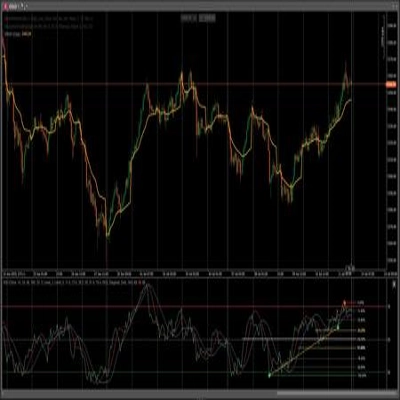
Динамическая рыночная структура
Анализ поворотных точек
Fibonacci Linear
Регрессия на нескольких таймфреймах
Многоуровневый свечной уклон
Трекер
Автоматическая поддержка и
линии сопротивления тренда
Все уровни поддержки и
сопротивления
Динамический диапазон импульса
Индикатор ShieldedTrend основан на умном сочетании двух широко используемых торговых методологий: свечи Heikin-Ashi 📊 и экспоненциальные скользящие средние (EMA) 📈. Вот пошаговая логика:
1️⃣ Основа: Модифицированные свечи Heikin-Ashi
Свечи Heikin-Ashi — это сглаженная версия традиционных свечей, предназначенная для фильтрации рыночного шума. Их оригинальный расчет использует средние цены, но ShieldedTrend модифицирует их двумя ключевыми способами:
- Закрытие Heikin-Ashi:
Вычисляется как среднее из 4 основных цен реальной свечи:
(Open + High + Low + Close) / 4 🔄. - Открытие Heikin-Ashi:
Берется не напрямую из реальной цены, а как среднее между открытием и закрытием предыдущей свечи Heikin-Ashi.
Это создает естественный эффект "сглаживания" , который устраняет резкие колебания, делая тренды более четкими.
2️⃣ Сглаживание с помощью EMA
ShieldedTrend применяет экспоненциальную скользящую среднюю (EMA) к обоим компонентам свечей Heikin-Ashi:
- Сглаженная линия открытия:
EMA, примененная к открытию Heikin-Ashi. - Сглаженная линия закрытия:
EMA, примененная к закрытию Heikin-Ashi.
EMA придает больший вес последним данным, позволяя индикатору быстро реагировать на изменения тренда при сохранении сглаженности.
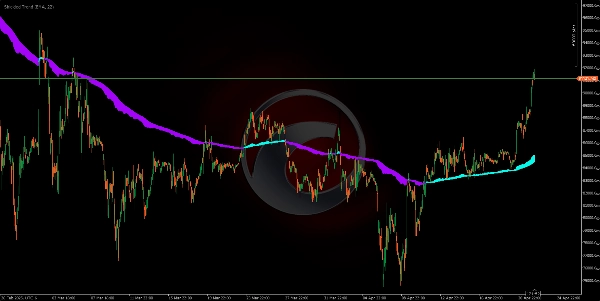
3️⃣ "Зона защиты" (Щит) 🛡️
Цветная область между двумя линиями (сглаженным открытием и закрытием) служит буферной или зоной подтверждения:
- Ширина зоны:
Зависит от разницы между двумя линиями. -
- Широкая зона = Сильный тренд (линии далеко друг от друга) 💪.
- Узкая зона = Неопределенность или слабый тренд 🤔.
4️⃣ Интегрированная торговая логика
- Сигнал тренда:
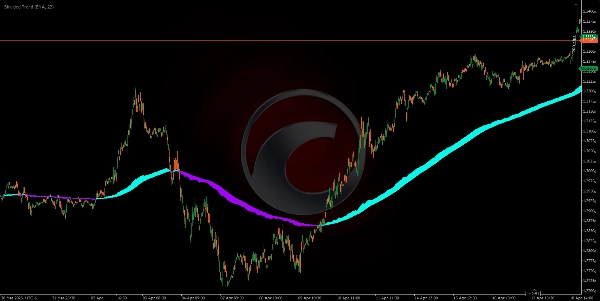
Изменение цвета указывает на возможный разворот (например, с циана на пурпурный = возможное начало нисходящего тренда) 🔵🟣. - Сила тренда:
Ширина цветной зоны служит фильтром уверенности: -
- Торгуйте только если зона достаточно широка (избегает флетовых рынков) ✅.
- Защита от ложных движений:
Если зона внезапно сужается, это говорит о том, что текущий тренд может терять силу — даже если цвет еще не изменился ⚠.
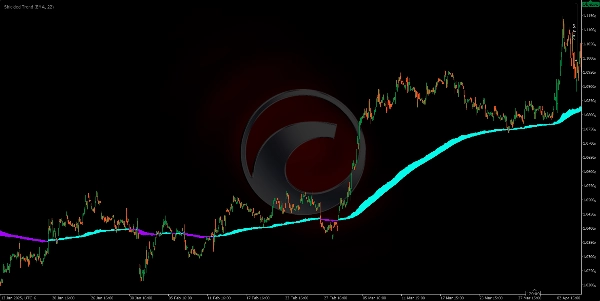
🌟 Почему это работает?
- Heikin-Ashi + EMA: Дважды сглаживает цену (свечи + скользящая средняя), фильтруя 90% шума 🎯.
- Зона защиты: Избегает торговли на неясных рынках, снижая количество неудачных сделок 📉➡️📈.
- Визуальный подход: Сочетание цвета и зоны позволяет даже начинающим трейдерам быстро распознавать паттерны ⚡.
Сводка
The indicator applies EMA smoothing to both the Heikin-Ashi open and close lines, enabling quick reaction to trend changes while maintaining smoothness. The area between these two smoothed lines forms a "Protection Zone" or shield, which acts as a buffer and confirmation zone. The width of this zone indicates trend strength: a wide zone signals a strong trend, while a narrow zone suggests indecision or a weak trend.
ShieldedTrend’s integrated trading logic uses color changes to signal potential trend reversals and the zone width as a confidence filter to avoid trading in choppy markets. The indicator helps protect against false moves by signaling when trend momentum is weakening even before a color change occurs. Its visual design facilitates quick pattern recognition, making it accessible for traders of all experience levels.