
Описание
Закрепите расчет скользящей средней за любым моментом рынка и отслеживайте поведение цены по мере её продвижения вперед.
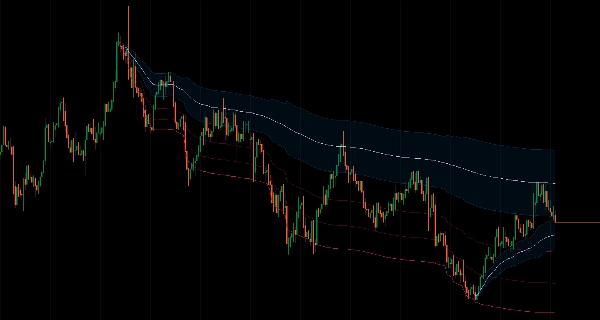
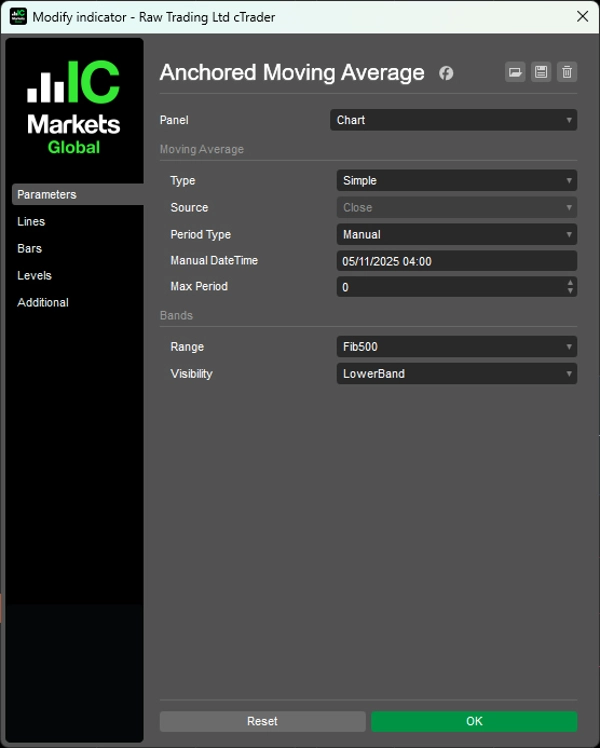
Закрепляет расчет за выбранной вами отправной точкой (ручная дата и время или период обратного отсчёта от 1 часа до 10 лет), затем естественно растет с адаптивными полосами Фибоначчи, основанными на фактическом ценовом диапазоне.
Восемь уровней Фибоначчи (от 11,4% до 100%), которые адаптируются к реальному движению цены, встроенная зона среднеоткатного возврата 38,2%-62,8%, два типа скользящих средних (SMA/EMA), несколько режимов отображения (полные полосы, только крайние границы, только зона возврата) и ограничитель максимального периода для долгосрочных таймфреймов обеспечивают отслеживание импульса на основе событий для трейдеров, ориентированных на откаты от значимых точек разворота и анализ поведения цены после событий.
ОСОБЕННОСТИ
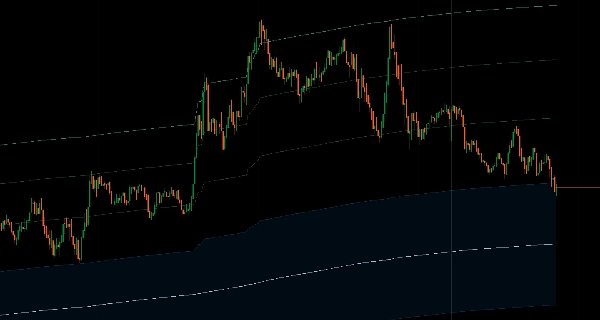
Расчет с привязкой ко времени
- В отличие от стандартных скользящих средних с фиксированными периодами, эта растет естественно от выбранной вами отправной точки
- Гибкая привязка: установите ручную дату и время или используйте предопределённые периоды обратного отсчёта (от 1 часа до 10 лет)
- Отслеживайте импульс от значимых рыночных моментов
- Последовательные точки привязки на разных таймфреймах
Адаптивные полосы Фибоначчи
- Автоматически рассчитываемые полосы на основе фактического ценового диапазона, а не произвольных кратных ATR
- 8 уровней Фибоначчи (от 11,4% до 100%), которые адаптируются к реальному движению цены
- Зоны среднеоткатного возврата: встроенная зона возврата 38,2%-62,8% для областей с высокой вероятностью входа
- Математически определённые вероятностные зоны
Два типа скользящих средних
- Простая скользящая средняя
- Экспоненциальная скользящая средняя
- Ограничитель максимального периода: предотвращает чрезмерное сглаживание на долгосрочных таймфреймах
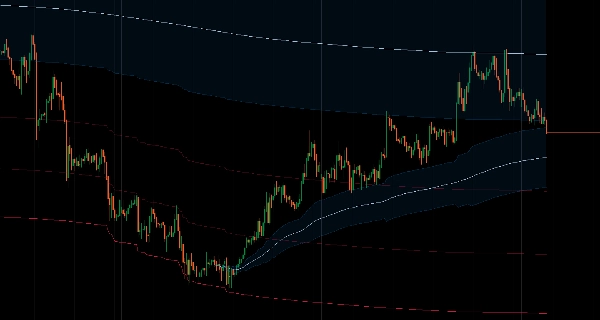
Несколько режимов отображения
- Полные полосы: видны все уровни Фибоначчи
- Только верхняя/нижняя: показывать крайние границы
- Только зона возврата: фокус на области среднеоткатного возврата
- Чистый, целенаправленный дизайн без загромождений
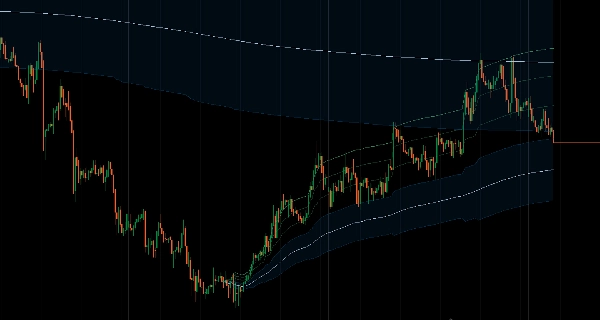
Анализ на основе событий
- Смотрите, как текущая цена соотносится с движением от значимых уровней
- Отслеживайте поведение цены после событий
- Входы на основе структуры с чёткими контрольными точками
__________________________________________________________________________________________
БОЛЬШЕ БЕСПЛАТНЫХ ИНДИКАТОРОВ
Исследуйте широкий спектр инструментов анализа рынка — от структуры и объема до регрессии, волатильности и пользовательских таймфреймов.
Исходный код доступен в репозитории на GitHub.
Все бесплатно для использования. Но если хотите поддержать кофе, можете сделать это здесь.
Поддержка/Сопротивление
Объем
- Volume Activity Profiler
- Volume Efficiency Analyzer
- Volume Profile Analytics
- Volume Profile - Updated
- Volume Spread Analysis
- VWAP (Volume Weighted Average Price)
Скользящие средние
- SSL Channel
- Anchored Moving Average
- Deviation-Scaled Moving Average
- Gann High Low Activator
- Instantaneous Trendline
- Kaufman Adaptive MA with Trend Vision
- Moving Average Channel
- Moving Averages Suite
- Trend Channel Moving Average
Утилиты/Пользовательские
На основе регрессии
Волатильность
Осцилляторы
__________________________________________________________________________________________
ОТКАЗ ОТ ОТВЕТСТВЕННОСТИ
Торговля связана с риском. Этот индикатор предназначен только для технического анализа — всегда применяйте надлежащее управление рисками и торгуйте ответственно.
ОБРАТНАЯ СВЯЗЬ И УЛУЧШЕНИЯ
Если у вас есть предложения, запросы функций или идеи для улучшения, пожалуйста, оставьте комментарий на вкладке Обсуждение. Ваш отзыв помогает улучшить индикатор для всех.
Сводка
The indicator features adaptive Fibonacci bands calculated based on the actual price range, not arbitrary multiples. It includes eight Fibonacci levels from 11.4% to 100%, with a built-in mean reversion zone between 38.2% and 62.8%, providing mathematically defined probability zones for potential entry areas. Multiple display modes are available, including full bands, extreme boundaries only, or reversion zone only, designed for a clean and purposeful chart presentation.
This tool facilitates analysis of price behavior relative to significant swing points or events, supporting structured entries and post-event price tracking. It is intended for technical analysis and includes a disclaimer advising responsible trading with proper risk management.
Отзывы покупателей
5 | 100 % | |
4 | 0 % | |
3 | 0 % | |
2 | 0 % | |
1 | 0 % |


